Advertisements
Advertisements
प्रश्न
Read the bar graph shown in Fig. 23.10 and answer the following questions
(i) What is the information given by the bar graph?
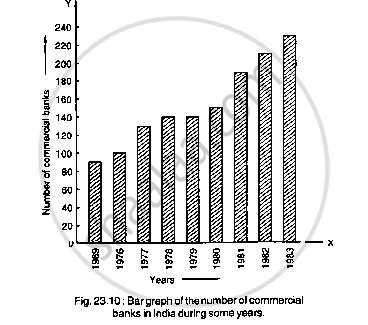
(ii) What was the number of commercial banks in 1977?
(iii) What is the ratio of the number of commercial banks in 1969 to that in 1980?
(iv) State whether true or false:
The number of commercial banks in 1983 is less than double the number of commercial banks in 1969.
उत्तर
(i) Given bar graph represents the number of commercial banks in India during some years.
(ii) The number of commercial banks in 1977 was
`120+(140-120)/2`
`=120+20/2`
=120+10
= 130.
(iii) The ratio of the number of commercial banks in 1969 was
`80 +(100-80)/2`
`=80+20/2`
=80+10
= 90
The number of commercial banks in 1980 was
`140+(160-140)/2`
`=140+20/2`
= 140+10
= 150
Hence, the required ratio is
`90/150`
=`3/5`
=3: 5
(iv) The number of commercial banks in 1983 was
`220+(240-220)/2`
`220+20/2`
=220+10
= 230
The number of commercial banks in 1969 was 90. When we multiply this number by 2, it becomes
2 × 90
= 180
Clearly, 230 is not less than 180.
Hence the statement is false.
APPEARS IN
संबंधित प्रश्न
The bar graph shown in Fig 23.16 represents the circulation of newspapers in 10 languages. Study the bar graph and answer the following questions:

(i) What is the total number of newspapers published in Hindi, English, Urdu, Punjabi and Bengali?
(ii) What percent is the number of news papers published in Hindi of the total number of newspapers?
(iii) Find the excess of the number of newspapers published in English over those published in Urdu.
(iv) Name two pairs of languages which publish the same number of newspapers.
(v) State the language in which the smallest number of newspapers are published.
(vi) State the language in which the largest number of newspapers are published.
(vii) State the language in which the number of newspapers published is between 2500 and 3500.
(viii) State whether true or false:
a. The number of newspapers published in Malayalam and Marathi together is less than those published in English.
b. The number of newspapers published in Telugu is more than those published in Tamil.
Read the bar graph given in Fig. 23.22 and answer the following questions:
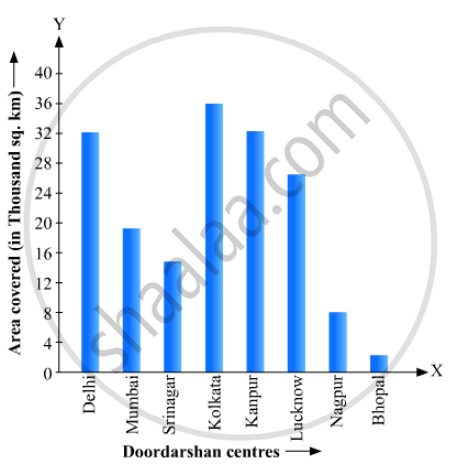
(i) What information is given by the bar graph?
(ii) Which Doordarshan centre covers maximum area? Also tell the covered area.
(iii) What is the difference between the areas covered by the centres at delhi and Bombay?
(iv) Which Doordarshan centres are in U.P State? What are the areas covered by them?
In a histogram the class intervals or the group are taken along
Construct a frequency polygon for the following distribution:
| Class-intervals | 0-4 | 4 - 8 | 8 - 12 | 12 - 16 | 16 - 20 | 20 - 24 |
| Frequency | 4 | 7 | 10 | 15 | 11 | 6 |
Construct a combined histogram and frequency polygon for the following frequency distribution:
| Class-Intervals | 10 - 20 | 20 - 30 | 30 - 40 | 40 - 50 | 50 - 60 |
| Frequency | 3 | 5 | 6 | 4 | 2 |
The following table shows the market position of different brands of tea-leaves.
| Brand | A | B | C | D | others |
| % of Buyers | 35 | 20 | 20 | 15 | 10 |
Draw it-pie-chart to represent the above information.
The number of students (boys and girls) of class IX participating in different activities during their annual day function is given below:
| Activities | Dance | Speech | Singing | Quiz | Drama | Anchoring |
| Boys | 12 | 5 | 4 | 4 | 10 | 2 |
| Girls | 10 | 8 | 6 | 3 | 9 | 1 |
Draw a double bar graph for the above data.
The expenditure of a family on different heads in a month is given below:
| Head | Food | Education | Clothing | House Rent | Others | Savings |
| Expenditure (in Rs) |
4000 | 2500 | 1000 | 3500 | 2500 | 1500 |
Draw a bar graph to represent the data above.
The following table gives the frequencies of most commonly used letters a, e, i, o, r, t, u from a page of a book:
| Letters | a | e | i | o | r | t | u |
| Frequency | 75 | 125 | 80 | 70 | 80 | 95 | 75 |
Represent the information above by a bar graph.
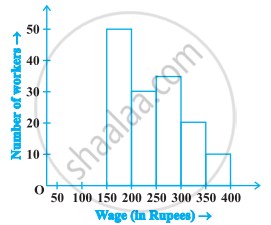
In the following figure, there is a histogram depicting daily wages of workers in a factory. Construct the frequency distribution table.