Advertisements
Advertisements
प्रश्न
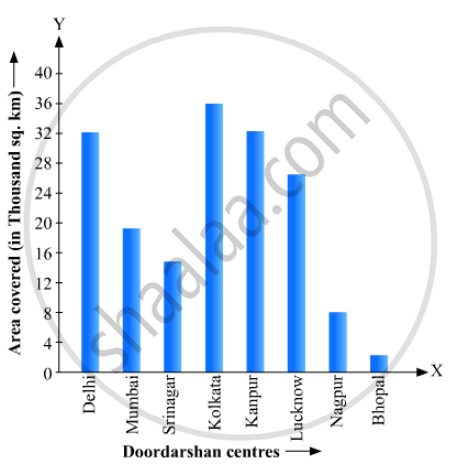
Read the bar graph given in Fig. 23.22 and answer the following questions:

(i) What information is given by the bar graph?
(ii) Which Doordarshan centre covers maximum area? Also tell the covered area.
(iii) What is the difference between the areas covered by the centres at delhi and Bombay?
(iv) Which Doordarshan centres are in U.P State? What are the areas covered by them?
उत्तर
(1) The bar graph represents the area of coverage (in 1000 square km) of some Doordarshan Centers of India.
(2) It is seen from the bar graph that the height of the 4th bar from the left is maximum, which is corresponding to Kolkata. Hence, the Kolkata Doordarshan covers maximum area. The area covered by Kolkata Doordarshan is
36 ×1000
= 36000 sq.km
(3) The area covered by Delhi Doordarshan is
34 ×1000
= 34000 sq.km
The area covered by Mumbai Doordarshan is
20 ×1000
= 20000 sq.km
Their difference is 34000 – 20000 = 14000 sq. km.
(4) The Doordarshan centers in Kanpur and Lucknow are in the U.P. state. The area covered by Kanpur Doordarshan is
32 ×1000
= 32000 sq.km
The area covered by Lucknow Doordarshan is
25 ×1000
= 25000 sq.km
APPEARS IN
संबंधित प्रश्न
A survey conducted by an organisation for the cause of illness and death among the women between the ages 15 - 44 (in years) worldwide, found the following figures (in %):-
| S.No. | Causes | Female fatality rate (%) |
| 1. | Reproductive health conditions | 31.8 |
| 2. | Neuropsychiatric conditions | 25.4 |
| 3. | Injuries | 12.4 |
| 4. | Cardiovascular conditions | 4.3 |
| 5. | Respiratory conditions | 4.1 |
| 6. | Other causes | 22.0 |
- Represent the information given above graphically.
- Which condition is the major cause of women’s ill health and death worldwide?
- Try to find out, with the help of your teacher, any two factors which play a major role in the cause in (ii) above being the major cause.
A random survey of the number of children of various age groups playing in a park was found as follows:
| Age (in years) | Number of children |
| 1 - 2 | 5 |
| 2 - 3 | 3 |
| 3 - 5 | 6 |
| 5 - 7 | 12 |
| 7 - 10 | 9 |
| 10 - 15 | 10 |
| 15 - 17 | 4 |
Draw a histogram to represent the data above.
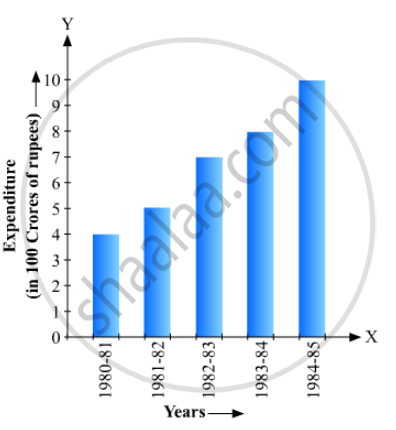
Read the bar graph given in Fig. 23.20 and answer the fol1owing questions:

(i) What information is given by the bar graph?
(ii) What was the expenditure on health and family planning in the year 1982-83?
(iii) In which year is the increase in expenditure maximum over the expenditure in previous year? What is the maximum increase?
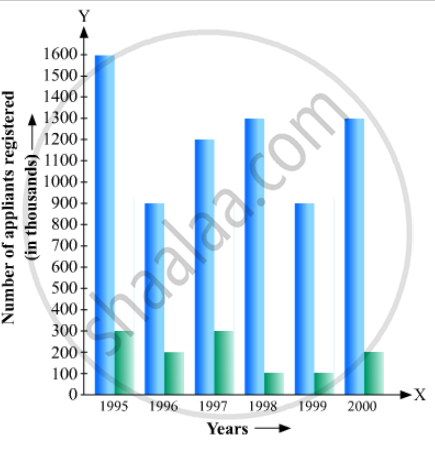
The following data gives the number (in thousands) of applicants registered with an
| Year | 1995 | 1996 | 1997 | 1998 | 1999 | 2000 |
| Number of applicants registered (in thousands) | 18 | 20 | 24 | 28 | 30 | 34 |
Construct a bar graph to represent the above data.

The following table gives the route length (in thousand kilometres) of the Indian Railways in some of the years:
| Year | 1960-61 | 1970-71 | 1980-81 | 1990-91 | 2000-2001 |
| Route length (in thousand km) |
56 | 60 | 61 | 74 | 98 |
Represent the above data with the help of a bar graph.
The following data gives the amount of loans (in crores of rupees) disbursed by a bank during some years:
| Year | 1992 | 1993 | 1994 | 1995 | 1996 |
| Loan (in crores of rupees) |
28 | 33 | 55 | 55 | 80 |
(i) Represent the above data with the help of a bar graph.
(ii) With the help of the bar graph, indicate the year in which amount of loan is not increased over that of the preceding year.
The following is the distribution of total household expenditure (in Rs.) of manual worker in a city:
| Expenditure (in Rs): |
100-150 | 150-200 | 200-250 | 250-300 | 300-350 | 350-400 | 400-450 | 450-500 |
| No. of manual workers: | 25 | 40 | 33 | 28 | 30 | 22 | 16 | 8 |
Draw a histogram and a frequency polygon representing the above data.
A histogram is a pictorial representation of the grouped data in which class intervals and frequency are respectively taken along
Draw frequency polygons for each of the following frequency distribution:
(a) using histogram
(b) without using histogram
|
C.I |
5 -15 | 15 -25 | 25 -35 | 35 - 45 | 45-55 | 55-65 |
| ƒ | 8 | 16 | 18 | 14 | 8 | 2 |
Construct a frequency polygon for the following data:
| Class-Intervals | 10 - 14 | 15 - 19 | 20 - 24 | 25 - 29 | 30 - 34 |
| Frequency | 5 | 8 | 12 | 9 | 4 |
