Advertisements
Advertisements
प्रश्न
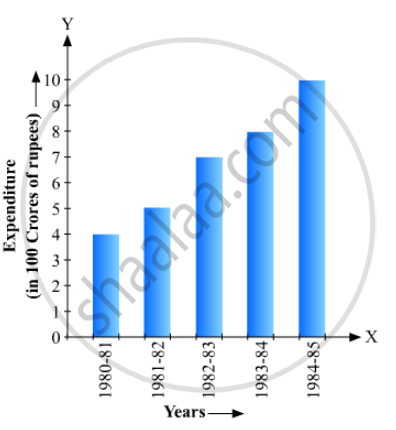
Read the bar graph given in Fig. 23.20 and answer the fol1owing questions:

(i) What information is given by the bar graph?
(ii) What was the expenditure on health and family planning in the year 1982-83?
(iii) In which year is the increase in expenditure maximum over the expenditure in previous year? What is the maximum increase?
उत्तर
(1) The bar graph represents the expenditure (in 100 Crores of rupees) on health and family planning during the Sixth Five Year Plan in India.
(2) The height of the 2nd bar from the left is 7 units, which is corresponding to the year 1982-83. Hence, the expenditure on health and family planning in the year 1982-83 was 700 Crores rupees.
(3) Take the year 1980-81 as the initial year of expenditure. Then
(a) The increase in expenditure in the year 1981-82 is 5 – 4 = 1 unit.
(b) The increase in expenditure in the year 1982-83 is 7 – 5 = 2 units.
(c) The increase in expenditure in the year 1983-84 is 8 – 7 = 1 unit.
(d) The increase in expenditure in the year 1984-85 is 10.2 – 8 = 2.2 units.
Hence, in the year 1984-85 the increase in expenditure is the maximum and the maximum increase is 2.2 × 100 = 220 Crores rupees
APPEARS IN
संबंधित प्रश्न
The following tables gives the quantity of goods (in crore tonnes)
| Year | 1950-51 | 1960-61 | 1965-66 | 1970-71 | 1980-81 | 1982-83 |
| Quantity of Goods (in crore tonnes) |
9 | 16 | 20 | 20 | 22 | 26 |
Explain through the bar graph if the quantity of goods carried by the Indian Railways in 1965-66 is more than double the quantity of goods carried in the year 1950-51.
A frequency polygon is constructed by plotting frequency of the class interval and the
In a histogram the area of each rectangle is proportional to
In a histogram, each class rectangle is constructed with base as
A hundred students from a certain locality use different modes of travelling to school as given below. Draw a bar graph.
| Bus | Car | Rickshaw | Bicycle | Walk |
| 32 | 16 | 24 | 20 | 8 |
Students of a small school use different modes of travel to school as shown below:
| Mode | Bus | Car | Bicycle | Auto | On foot |
| No. of students | 142 | 98 | 50 | 34 | 16 |
Draw a suitable bar graph.
For the following table, draw a bar-graph
| A | B | C | D | E | F |
| 230 | 400 | 350 | 200 | 380 | 160 |
For the following data, draw a pie graph.
| Subject | Hindi | English | Maths | Science | Social Study |
| Marks as percent | 60 | 45 | 42 | 48 | 75 |
Mr. Mirza’s monthly income is Rs. 7,200. He spends Rs. 1,800 on rent, Rs. 2,700 on food, Rs. 900 on the education of his children; Rs. 1,200 on Other things and saves the rest.
Draw a pie-chart to represent it.
Harmeet earns Rs.50 000 per month. He a budget for his salary as per the following table:
| Expenses | Accommodation | Food | Clothing | Travel | Miscellaneous | saving |
| Amount (Rs.) | 12000 | 9000 | 2500 | 7500 | 4000 | 15000 |
Draw a bar graph for the above data.
