Advertisements
Advertisements
प्रश्न
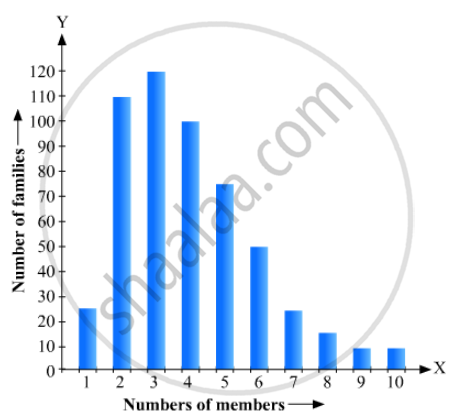
Read the bar graph given in Fig. 23.21 and answer the following questions:
(i) What is the information given by the bar graph?
(ii) What is the number of families having 6 members?
(iii) How many members per family are there in the maximum number of families? Also tell the number of such families.
(iv) What are the number of members per family for which the number of families are equal? Also, tell the number of such families?
उत्तर
(i) It gives the information about the number of families with different number of members in a locality.
(ii) The number of families having 6 members = 50
(iii) 3 members per family are there in the maximum number of families The number of families which have 3 members = 120.
(iv) 9 and 10 are the number of members per family for which the number of families are equal The number of such families is 5.
APPEARS IN
संबंधित प्रश्न
The length of 40 leaves of a plant are measured correct to one millimetre, and the obtained data is represented in the following table:-
| Length (in mm) | Number of leaves |
| 118 - 126 | 3 |
| 127 - 135 | 5 |
| 136 - 144 | 9 |
| 145 - 153 | 12 |
| 154 - 162 | 5 |
| 163 - 171 | 4 |
| 172 - 180 | 2 |
- Draw a histogram to represent the given data. [Hint: First make the class intervals continuous]
- Is there any other suitable graphical representation for the same data?
- Is it correct to conclude that the maximum number of leaves are 153 mm long? Why?
100 surnames were randomly picked up from a local telephone directory and a frequency distribution of the number of letters in the English alphabet in the surnames was found as follows:
| Number of letters | Number of surnames |
| 1 - 4 | 6 |
| 4 - 6 | 30 |
| 6 - 8 | 44 |
| 8 - 12 | 16 |
| 12 - 20 | 4 |
- Draw a histogram to depict the given information.
- Write the class interval in which the maximum number of surnames lie.
The time taken, in seconds, to solve a problem by each of 25 pupils is as follows:
16, 20, 26, 27, 28, 30, 33, 37, 38, 40, 42, 43, 46, 46, 46, 48, 49, 50, 53, 58, 59, 60, 64, 52, 20
(a) Construct a frequency distribution for these data, using a class interval of 10 seconds.
(b) Draw a histogram to represent the frequency distribution.
Draw, in the same diagram, a histogram and a frequency polygon to represent the following data which shows the monthly cost of living index of a city in a period of 2 years:
| Cost of living index: |
440-460 | 460-480 | 480-500 | 500-520 | 520-540 | 540-560 | 560-580 | 580-600 |
| No. of months: | 2 | 4 | 3 | 5 | 3 | 2 | 1 | 4 |
The monthly profits (in Rs.) of 100 shops are distributed as follows:
| Profits per shop: | 0-50 | 50-100 | 100-50 | 150-200 | 200-250 | 250-300 |
| No. shops: | 12 | 18 | 27 | 20 | 17 | 6 |
Draw a histogram for the data and show the frequency polygon for it.
In a frequency distribution, ogives are graphical representation of
A frequency polygon is constructed by plotting frequency of the class interval and the
In a histogram the area of each rectangle is proportional to
A histogram is a pictorial representation of the grouped data in which class intervals and frequency are respectively taken along
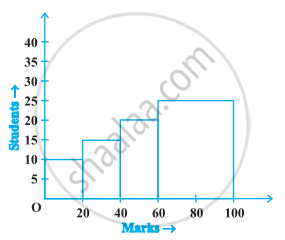
The frequency distribution has been represented graphically as follows:
| Marks | 0 – 20 | 20 – 40 | 40 – 60 | 60 – 100 |
| Number of Students | 10 | 15 | 20 | 25 |

Do you think this representation is correct? Why?
