Advertisements
Advertisements
Question
Read the bar graph given in Fig. 23.21 and answer the following questions:
(i) What is the information given by the bar graph?
(ii) What is the number of families having 6 members?
(iii) How many members per family are there in the maximum number of families? Also tell the number of such families.
(iv) What are the number of members per family for which the number of families are equal? Also, tell the number of such families?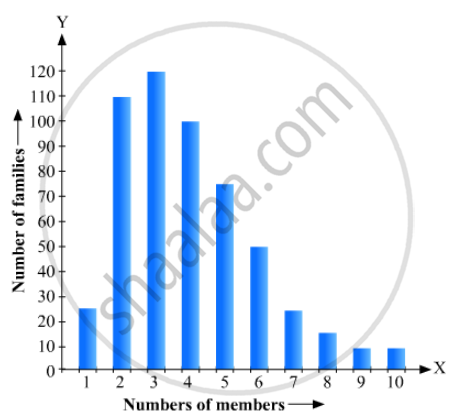
Solution
(i) It gives the information about the number of families with different number of members in a locality.
(ii) The number of families having 6 members = 50
(iii) 3 members per family are there in the maximum number of families The number of families which have 3 members = 120.
(iv) 9 and 10 are the number of members per family for which the number of families are equal The number of such families is 5.
APPEARS IN
RELATED QUESTIONS
Given below are the seats won by different political parties in the polling outcome of a state assembly elections:-
| Political Party | A | B | C | D | E | F |
| Seats Won | 75 | 55 | 37 | 29 | 10 | 37 |
- Draw a bar graph to represent the polling results.
- Which political party won the maximum number of seats?
The following bar graph (Fig. 23. 1 4) represents the heights (in cm) of 50 students of Class XI of a particular school. Study the graph and answer the following questions:
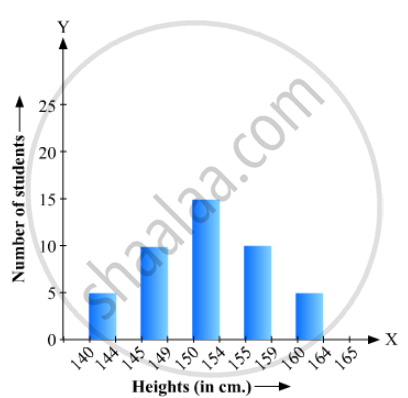
(i) What percentage of the total number of students have their heights more than 149cm?
(ii) How many students in the class are in the range of maximum height of the class?
(iii) The school wants to provide a particular type of tonic to each student below the height
of 150 cm to improve his height. If the cost of the tonic for each student comes out to be Rs. 55, how much amount of money is required?
(iv) How many students are in the range of shortest height of the class?
(v) State whether true or false:
a. There are 9 students in the class whose heights are in the range of 155 - 159 cm.
b. Maximum height (in cm) of a student in the class is 17.
c. There are 29 students in the class whose heights are in the range of 145- 154 cm.
d. Minimum height (in cm) of a student is the class is in the range of 140 – 144 cms.
e. The number of students in the class having their heights less than 150 cm is 12.
f. There are 14 students each of whom has height more than 154. cm.
Read the bar graph given in Fig. 23.17 and answer the following questions:
(i) What information is given by the bar graph?
(ii) What was the crop-production of rice in 1970 - 71?
(iii) What is the difference between the maximum and minimum production of rice?

Draw a histogram for the daily earnings of 30 drug stores in the following table:
| Daily earning (in Rs): |
450-500 | 500-550 | 550-600 | 600-650 | 650-700 |
| Number of Stores: | 16 | 10 | 7 | 3 | 1 |
In a histogram, each class rectangle is constructed with base as
Draw frequency polygons for each of the following frequency distribution:
(a) using histogram
(b) without using histogram
|
C.I |
10 - 30 |
30 - 50 |
50 - 70 | 70 - 90 | 90 - 110 | 110 - 130 | 130 - 150 |
| ƒ | 4 | 7 | 5 | 9 | 5 | 6 | 4 |
Construct a frequency polygon for the following data:
| Class-Intervals | 10 - 14 | 15 - 19 | 20 - 24 | 25 - 29 | 30 - 34 |
| Frequency | 5 | 8 | 12 | 9 | 4 |
Construct a combined histogram and frequency polygon for the following frequency distribution:
| Class-Intervals | 10 - 20 | 20 - 30 | 30 - 40 | 40 - 50 | 50 - 60 |
| Frequency | 3 | 5 | 6 | 4 | 2 |
The following table shows the market position of different brands of tea-leaves.
| Brand | A | B | C | D | others |
| % of Buyers | 35 | 20 | 20 | 15 | 10 |
Draw it-pie-chart to represent the above information.
The following table gives the frequencies of most commonly used letters a, e, i, o, r, t, u from a page of a book:
| Letters | a | e | i | o | r | t | u |
| Frequency | 75 | 125 | 80 | 70 | 80 | 95 | 75 |
Represent the information above by a bar graph.
