Advertisements
Advertisements
Question
Given below are the seats won by different political parties in the polling outcome of a state assembly elections:-
| Political Party | A | B | C | D | E | F |
| Seats Won | 75 | 55 | 37 | 29 | 10 | 37 |
- Draw a bar graph to represent the polling results.
- Which political party won the maximum number of seats?
Solution
(i) By taking polling results on x-axis and seats won as y-axis and choosing an appropriate scale (1 unit = 10 seats for y-axis), the required graph of the above information can be constructed as follows.
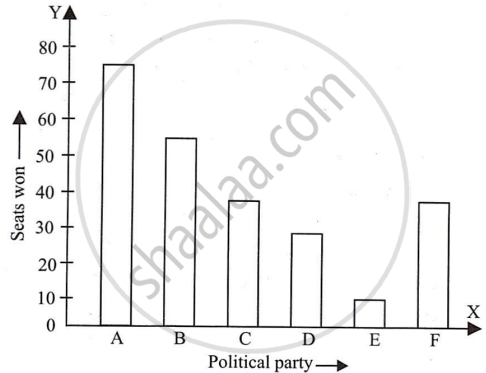
Here, the rectangle bars are of the same length and have equal spacing in between them.
(ii) Political party ‘A’ won the maximum number of seats.
APPEARS IN
RELATED QUESTIONS
Given below (Fig. below) is the bar graph indicating the marks obtained out of 50 in mathematics paper by 100 students. Read the bar graph and answer the following questions:

(i) It is decided to distribute work books on mathematics to the students obtaining less than 20 marks, giving one workbook to each of such students. If a work book
costs Rs 5, what sum is required to buy the work books?
(ii) Every student belonging to the highest mark group is entitled to get a prize of Rs. 10. How much amount of money is required for distributing the prize money?
(iii) Every student belonging to the lowest mark—group has to solve 5 problems per day. How many problems, in all, will be solved by the students of this group per day?
(iv) State whether true or false.
a. 17% students have obtained marks ranging from 40 to 49.
b. 59 students have obtained marks ranging from 10 to 29.
(v) What is the number of students getting less than 20 marks?
(vi) What is the number of students getting more than 29 marks?
(vii) What is the number of students getting marks between 9 and 40?
(viii) What is the number of students belonging to the highest mark group?
(ix) What is the number of students obtaining more than 19 marks?
Read the following bar graph(Fig. 23.15) and answer the following questions:
(i) What information is given by the bar graph?
(ii) What was the production of a student in the year 1980 - 81?
(iii) What is the minimum and maximum productions of cement and corresponding years?

The following table shows the interest paid by a company (in lakhs):
| Year | 1995-96 | 1996-97 | 1997-98 | 1998-99 | 1999-2000 |
| Interest (in lakhs of rupees | 20 | 25 | 15 | 18 | 30 |
Draw the bar graph to represent the above information.
The following data shows the average age of men in various countries in a certain year:
| Country | India | Nepal | China | Pakistan | U.K | U.S.A |
| Average age (in years) |
55 | 52 | 60 | 50 | 70 | 75 |
Represent the above information by a bar graph.
In a histogram the area of each rectangle is proportional to
In the 'less than' type of ogive the cumulative frequency is plotted against
The percentage of marks obtained, in different subjects by Ashok Sharma (in an examination) is given below. Draw a bar graph to represent it.
| English | Hindi | Maths | Science | Social Studies |
| 85 | 60 | 35 | 50 | 70 |
The following tables show the mode of transport used by boys and girls for going to the same school.
| Bus | Bicycle | Walking | Other sources | |
|
Number of boys |
80 | 60 | 20 | 85 |
|
Number of girls |
90 | 75 | 35 | 60 |
Draw a double bar graph representing the above data.
For the following data, draw a pie graph.
| Subject | Hindi | English | Maths | Science | Social Study |
| Marks as percent | 60 | 45 | 42 | 48 | 75 |
The marks obtained (out of 100) by a class of 80 students are given below:
| Marks | Number of students |
| 10 – 20 | 6 |
| 20 – 30 | 17 |
| 30 – 50 | 15 |
| 50 – 70 | 16 |
| 70 – 100 | 26 |
Construct a histogram to represent the data above.
