Advertisements
Advertisements
Question
In the 'less than' type of ogive the cumulative frequency is plotted against
Options
the lower limit of the concerned class interval
the upper limit of the concerned class interval
the mid-value of the concerned class interval
any value of the concerned class interval
Solution
the upper limit of the concerned class interval
In the less than type of ogive the cumulative frequency is plotted against the upper limit of the concerned class interval.
APPEARS IN
RELATED QUESTIONS
Given below are the seats won by different political parties in the polling outcome of a state assembly elections:-
| Political Party | A | B | C | D | E | F |
| Seats Won | 75 | 55 | 37 | 29 | 10 | 37 |
- Draw a bar graph to represent the polling results.
- Which political party won the maximum number of seats?
The following bar graph (Fig. 23. 1 4) represents the heights (in cm) of 50 students of Class XI of a particular school. Study the graph and answer the following questions:
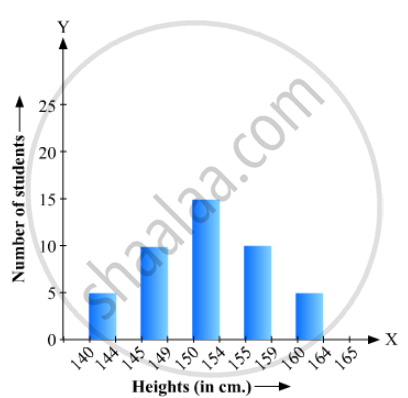
(i) What percentage of the total number of students have their heights more than 149cm?
(ii) How many students in the class are in the range of maximum height of the class?
(iii) The school wants to provide a particular type of tonic to each student below the height
of 150 cm to improve his height. If the cost of the tonic for each student comes out to be Rs. 55, how much amount of money is required?
(iv) How many students are in the range of shortest height of the class?
(v) State whether true or false:
a. There are 9 students in the class whose heights are in the range of 155 - 159 cm.
b. Maximum height (in cm) of a student in the class is 17.
c. There are 29 students in the class whose heights are in the range of 145- 154 cm.
d. Minimum height (in cm) of a student is the class is in the range of 140 – 144 cms.
e. The number of students in the class having their heights less than 150 cm is 12.
f. There are 14 students each of whom has height more than 154. cm.
The following table shows the number of Maruti cars sold by five dealers in a particular month:
| Dealer: | Saya | Bagga Links | D.D. Motors | Bhasin Motors | Competent |
| Cars sold: | 60 | 40 | 20 | 15 | 10 |
Represent the above information by a pictograph.
The time taken, in seconds, to solve a problem by each of 25 pupils is as follows:
16, 20, 26, 27, 28, 30, 33, 37, 38, 40, 42, 43, 46, 46, 46, 48, 49, 50, 53, 58, 59, 60, 64, 52, 20
(a) Construct a frequency distribution for these data, using a class interval of 10 seconds.
(b) Draw a histogram to represent the frequency distribution.
In a frequency distribution, ogives are graphical representation of
Construct a frequency polygon for the following data:
| Class-Intervals | 10 - 14 | 15 - 19 | 20 - 24 | 25 - 29 | 30 - 34 |
| Frequency | 5 | 8 | 12 | 9 | 4 |
The percentage of marks obtained, in different subjects by Ashok Sharma (in an examination) is given below. Draw a bar graph to represent it.
| English | Hindi | Maths | Science | Social Studies |
| 85 | 60 | 35 | 50 | 70 |
Mr. Kapoor compares the prices (in Rs.) of different items at two different shops A and B. Examine the following table carefully and represent the data by a double bar graph.
| Items | Price (in ₹) at the shop A | Price (in ₹) at the shop B |
|
Tea-set |
900 | 950 |
|
Mixie |
700 | 800 |
|
Coffee-maker |
600 | 700 |
|
Dinner set |
600 | 500 |
The following table shows the market position of different brands of tea-leaves.
| Brand | A | B | C | D | others |
| % of Buyers | 35 | 20 | 20 | 15 | 10 |
Draw it-pie-chart to represent the above information.
Is it correct to say that in a histogram, the area of each rectangle is proportional to the class size of the corresponding class interval? If not, correct the statement.
