Advertisements
Advertisements
प्रश्न
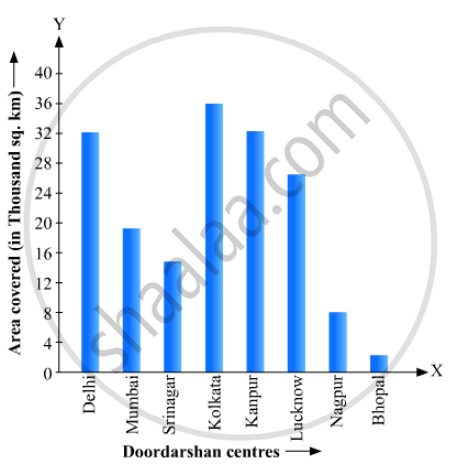
Read the bar graph given in Fig. 23.22 and answer the following questions:

(i) What information is given by the bar graph?
(ii) Which Doordarshan centre covers maximum area? Also tell the covered area.
(iii) What is the difference between the areas covered by the centres at delhi and Bombay?
(iv) Which Doordarshan centres are in U.P State? What are the areas covered by them?
उत्तर
(1) The bar graph represents the area of coverage (in 1000 square km) of some Doordarshan Centers of India.
(2) It is seen from the bar graph that the height of the 4th bar from the left is maximum, which is corresponding to Kolkata. Hence, the Kolkata Doordarshan covers maximum area. The area covered by Kolkata Doordarshan is
36 ×1000
= 36000 sq.km
(3) The area covered by Delhi Doordarshan is
34 ×1000
= 34000 sq.km
The area covered by Mumbai Doordarshan is
20 ×1000
= 20000 sq.km
Their difference is 34000 – 20000 = 14000 sq. km.
(4) The Doordarshan centers in Kanpur and Lucknow are in the U.P. state. The area covered by Kanpur Doordarshan is
32 ×1000
= 32000 sq.km
The area covered by Lucknow Doordarshan is
25 ×1000
= 25000 sq.km
APPEARS IN
संबंधित प्रश्न
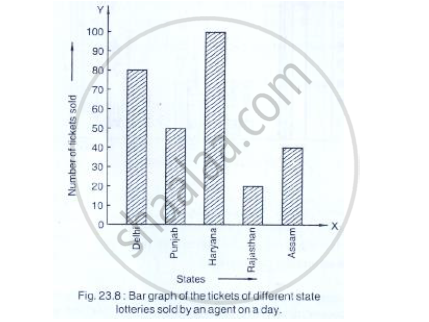
Read the bar graph shown in Fig. 23.8 and answer the following questions:

(i) What is the information given by the bar graph?
(ii) How many tickets of Assam State Lottery were sold by the agent?
(iii) Of which state, were the maximum number of tickets sold?
(iv) State whether true or false.
The maximum number of tickets sold is three times the minimum number of tickets sold.
(v) Of which state were the minimum number of tickets sold?
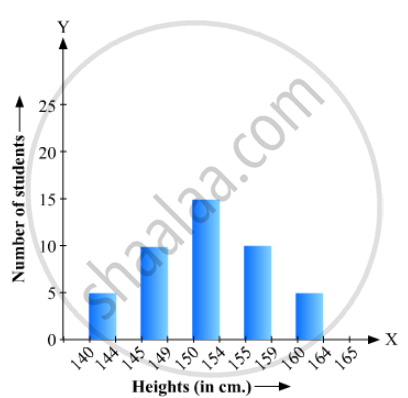
The following bar graph (Fig. 23. 1 4) represents the heights (in cm) of 50 students of Class XI of a particular school. Study the graph and answer the following questions:

(i) What percentage of the total number of students have their heights more than 149cm?
(ii) How many students in the class are in the range of maximum height of the class?
(iii) The school wants to provide a particular type of tonic to each student below the height
of 150 cm to improve his height. If the cost of the tonic for each student comes out to be Rs. 55, how much amount of money is required?
(iv) How many students are in the range of shortest height of the class?
(v) State whether true or false:
a. There are 9 students in the class whose heights are in the range of 155 - 159 cm.
b. Maximum height (in cm) of a student in the class is 17.
c. There are 29 students in the class whose heights are in the range of 145- 154 cm.
d. Minimum height (in cm) of a student is the class is in the range of 140 – 144 cms.
e. The number of students in the class having their heights less than 150 cm is 12.
f. There are 14 students each of whom has height more than 154. cm.
The bar graph shown in Fig 23.16 represents the circulation of newspapers in 10 languages. Study the bar graph and answer the following questions:

(i) What is the total number of newspapers published in Hindi, English, Urdu, Punjabi and Bengali?
(ii) What percent is the number of news papers published in Hindi of the total number of newspapers?
(iii) Find the excess of the number of newspapers published in English over those published in Urdu.
(iv) Name two pairs of languages which publish the same number of newspapers.
(v) State the language in which the smallest number of newspapers are published.
(vi) State the language in which the largest number of newspapers are published.
(vii) State the language in which the number of newspapers published is between 2500 and 3500.
(viii) State whether true or false:
a. The number of newspapers published in Malayalam and Marathi together is less than those published in English.
b. The number of newspapers published in Telugu is more than those published in Tamil.
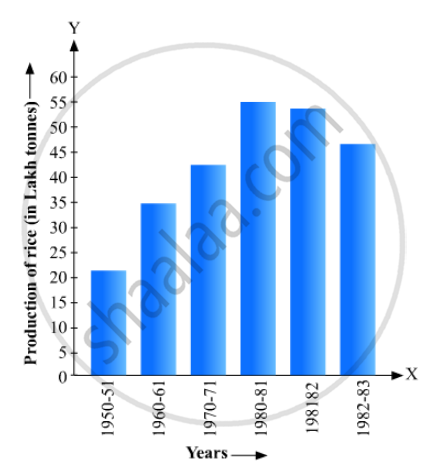
Read the bar graph given in Fig. 23.17 and answer the following questions:
(i) What information is given by the bar graph?
(ii) What was the crop-production of rice in 1970 - 71?
(iii) What is the difference between the maximum and minimum production of rice?

The following table shows the daily production of T. V. sets in an industry for 7 days of a week:
| Day | Mon | Tue | Wed | Thurs | Fri | Sat | Sun |
| Number of T.V. Sets | 300 | 400 | 150 | 250 | 100 | 350 | 200 |
Represent the above information by a pictograph .
In the 'less than' type of ogive the cumulative frequency is plotted against
Construct a combined histogram and frequency polygon for the following frequency distribution:
| Class-Intervals | 10 - 20 | 20 - 30 | 30 - 40 | 40 - 50 | 50 - 60 |
| Frequency | 3 | 5 | 6 | 4 | 2 |
Mr. Kapoor compares the prices (in Rs.) of different items at two different shops A and B. Examine the following table carefully and represent the data by a double bar graph.
| Items | Price (in ₹) at the shop A | Price (in ₹) at the shop B |
|
Tea-set |
900 | 950 |
|
Mixie |
700 | 800 |
|
Coffee-maker |
600 | 700 |
|
Dinner set |
600 | 500 |
For the following data, draw a pie graph.
| Subject | Hindi | English | Maths | Science | Social Study |
| Marks as percent | 60 | 45 | 42 | 48 | 75 |
Draw a histogram to represent the following grouped frequency distribution:
| Ages (in years) | Number of teachers |
| 20 – 24 | 10 |
| 25 – 29 | 28 |
| 30 – 34 | 32 |
| 35 – 39 | 48 |
| 40 – 44 | 50 |
| 45 – 49 | 35 |
| 50 – 54 | 12 |
