Advertisements
Advertisements
प्रश्न
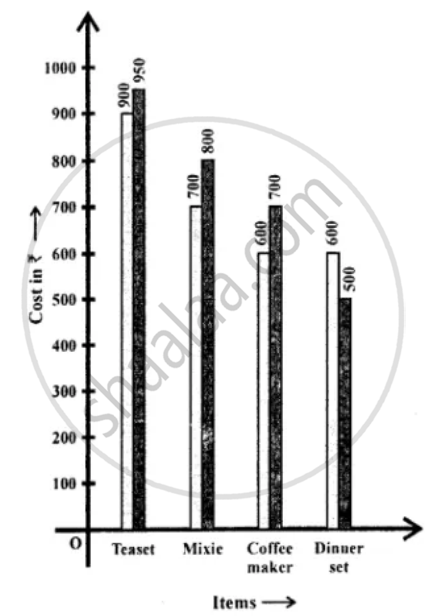
Mr. Kapoor compares the prices (in Rs.) of different items at two different shops A and B. Examine the following table carefully and represent the data by a double bar graph.
| Items | Price (in ₹) at the shop A | Price (in ₹) at the shop B |
|
Tea-set |
900 | 950 |
|
Mixie |
700 | 800 |
|
Coffee-maker |
600 | 700 |
|
Dinner set |
600 | 500 |
उत्तर

APPEARS IN
संबंधित प्रश्न
A random survey of the number of children of various age groups playing in a park was found as follows:
| Age (in years) | Number of children |
| 1 - 2 | 5 |
| 2 - 3 | 3 |
| 3 - 5 | 6 |
| 5 - 7 | 12 |
| 7 - 10 | 9 |
| 10 - 15 | 10 |
| 15 - 17 | 4 |
Draw a histogram to represent the data above.
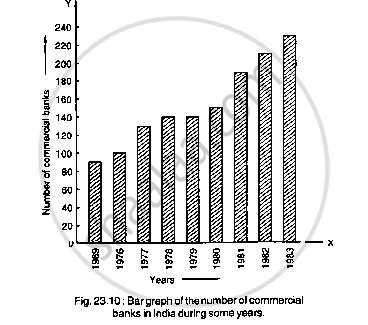
Read the bar graph shown in Fig. 23.10 and answer the following questions
(i) What is the information given by the bar graph?

(ii) What was the number of commercial banks in 1977?
(iii) What is the ratio of the number of commercial banks in 1969 to that in 1980?
(iv) State whether true or false:
The number of commercial banks in 1983 is less than double the number of commercial banks in 1969.
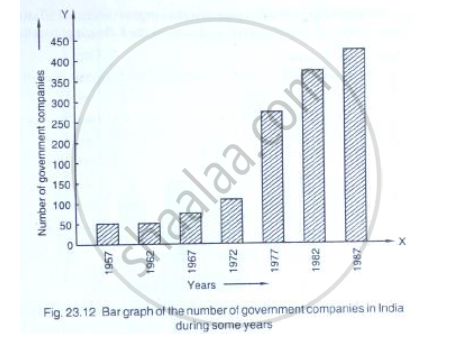
Read the following bar graph (Fig. 23.12) and answer the following questions:
(i) What is the information given by the bar graph?
(ii) State each of the following whether true or false.
a. The number of government companies in 1957 is that of 1982 is 1 :9.
b. The number of government companies have decreased over the year 1957 to 1983.

Read the following bar graph and answer the following questions:
(i) What information is given by the bar graph?
(ii) In which year the export is minimum?
(iii)In which year the import is maximum?
(iv)In which year the difference of the values of export and import is maximum?

The time taken, in seconds, to solve a problem by each of 25 pupils is as follows:
16, 20, 26, 27, 28, 30, 33, 37, 38, 40, 42, 43, 46, 46, 46, 48, 49, 50, 53, 58, 59, 60, 64, 52, 20
(a) Construct a frequency distribution for these data, using a class interval of 10 seconds.
(b) Draw a histogram to represent the frequency distribution.
Draw a histogram for the daily earnings of 30 drug stores in the following table:
| Daily earning (in Rs): |
450-500 | 500-550 | 550-600 | 600-650 | 650-700 |
| Number of Stores: | 16 | 10 | 7 | 3 | 1 |
A histogram is a pictorial representation of the grouped data in which class intervals and frequency are respectively taken along
Draw frequency polygons for each of the following frequency distribution:
(a) using histogram
(b) without using histogram
|
C.I |
10 - 30 |
30 - 50 |
50 - 70 | 70 - 90 | 90 - 110 | 110 - 130 | 130 - 150 |
| ƒ | 4 | 7 | 5 | 9 | 5 | 6 | 4 |
Manoj appeared for ICSE examination 2018 and secured percentage of marks as shown in the following table:
| Subject | Hindi | English | Maths | Science | Social Study |
| Marks as percent | 60 | 45 | 42 | 48 | 75 |
Represent the above data by drawing a suitable bar graph.
In a diagnostic test in mathematics given to students, the following marks (out of 100) are recorded:
46, 52, 48, 11, 41, 62, 54, 53, 96, 40, 98, 44
Which ‘average’ will be a good representative of the above data and why?
