Advertisements
Advertisements
प्रश्न
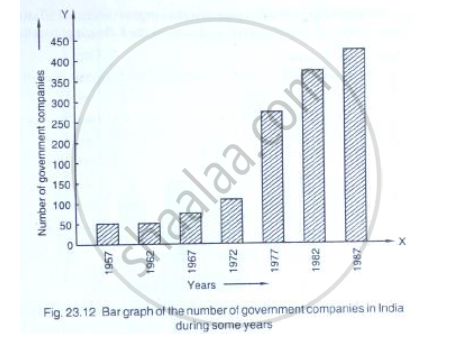
Read the following bar graph (Fig. 23.12) and answer the following questions:
(i) What is the information given by the bar graph?
(ii) State each of the following whether true or false.
a. The number of government companies in 1957 is that of 1982 is 1 :9.
b. The number of government companies have decreased over the year 1957 to 1983.
उत्तर
(i) The given Bar graph represents the number of government companies in india during some years.
(ii) (a) no. of government companies in 1957=50
Number of government companies in 1982=375
∴ The number of government companies in 1957 is that of 1982 = `50/375 = 2/15 ≠ 1/9`
So, the given statement is false
(b) The height of the bars increases over the years hence, the statement is false.
APPEARS IN
संबंधित प्रश्न
Study the bar graph representing the number of persons in various age groups in a town shown in Fig. below. Observe the bar graph and answer the following questions:
(i) What is the percentage of the youngest age-group persons over those in the oldest age group?
(ii) What is the total population of the town?
(iii) What is the number of persons in the age group 60 - 65?
(iv) How many persons are more in the age-group 10 - 15 than in the age group 30 - 35?
(v) What is the age-group of exactly 1200 persons living in the town?
(vi) What is the total number of persons living in the town in the age-group 50 - 55?
(vii) What is the total number of persons living in the town in the age-groups 10 - 15 and 60 - 65?
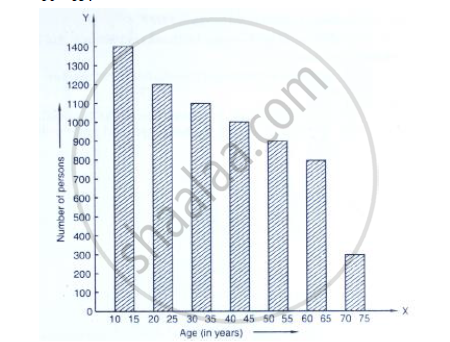
(viii) Whether the population in general increases, decreases or remains constant with the increase in the age-group.
The following table shows the number of Maruti cars sold by five dealers in a particular month:
| Dealer: | Saya | Bagga Links | D.D. Motors | Bhasin Motors | Competent |
| Cars sold: | 60 | 40 | 20 | 15 | 10 |
Represent the above information by a pictograph.
The population of Delhi State in different census years is as given below:
| Census year | 1961 | 1971 | 1981 | 1991 | 2001 |
| Population in Lakhs | 30 | 55 | 70 | 110 | 150 |
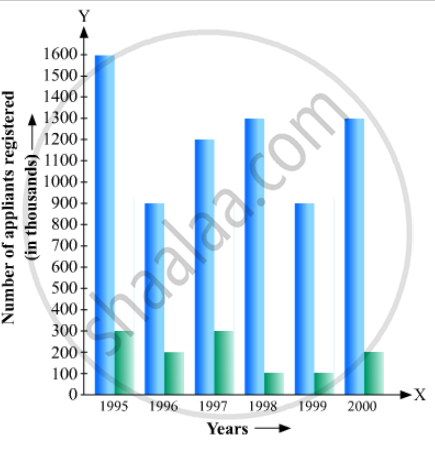
The following data gives the number (in thousands) of applicants registered with an
| Year | 1995 | 1996 | 1997 | 1998 | 1999 | 2000 |
| Number of applicants registered (in thousands) | 18 | 20 | 24 | 28 | 30 | 34 |
Construct a bar graph to represent the above data.
The production of oil (in lakh tonnes) in some of the refineries in India during 1982 was given below:
| Refinery: | Barauni | Koyali | Mathura | Mumbai | Florida |
| Production of oil (in lakh tonnes) |
30 | 70 | 40 | 45 | 25 |
Construct a bar graph to represent the above data so that the bars are drawn horizontally.
In a histogram the class intervals or the group are taken along
Students of a small school use different modes of travel to school as shown below:
| Mode | Bus | Car | Bicycle | Auto | On foot |
| No. of students | 142 | 98 | 50 | 34 | 16 |
Draw a suitable bar graph.
Read the following bar graph and answer the following questions: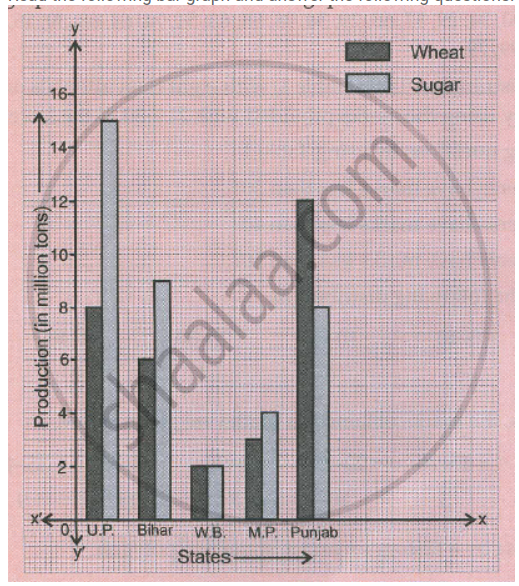
a. What information is given by the graph?
b. Which state is the largest producer of wheat?
c. Which state is the largest producer of sugar?
d. Which state has total production of wheat and sugar as its maximum?
e. Which state has the total production of wheat and sugar minimum?
The frequency distribution has been represented graphically as follows:
| Marks | 0 – 20 | 20 – 40 | 40 – 60 | 60 – 100 |
| Number of Students | 10 | 15 | 20 | 25 |
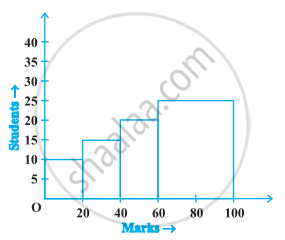
Do you think this representation is correct? Why?
The marks obtained (out of 100) by a class of 80 students are given below:
| Marks | Number of students |
| 10 – 20 | 6 |
| 20 – 30 | 17 |
| 30 – 50 | 15 |
| 50 – 70 | 16 |
| 70 – 100 | 26 |
Construct a histogram to represent the data above.
