Advertisements
Advertisements
प्रश्न
Read the following bar graph and answer the following questions:

(i) What information is given by the bar graph?
(ii) Which state is the largest producer of rice?
(iii) Which state is the largest producer of wheat?
(iv) Which state has total production of rice and wheat as its maximum?
(v) Which state has the total production of wheat and rice minimum?
उत्तर
(1) The bar graph represents the production of rice and wheat in different states of India.
(2) According to the height of the bars corresponding to rice, W.B. is the largest producer of rice.
(3) According to the height of the bars corresponding to wheat, U.P. is the largest producer of wheat.
(4) U.P. has the maximum total production of rice and wheat, which is 8 + 16 = 24 units
(5) Maharashtra has the minimum total production of rice and wheat, which are exactly 2 + 4 = 6 units.
APPEARS IN
संबंधित प्रश्न
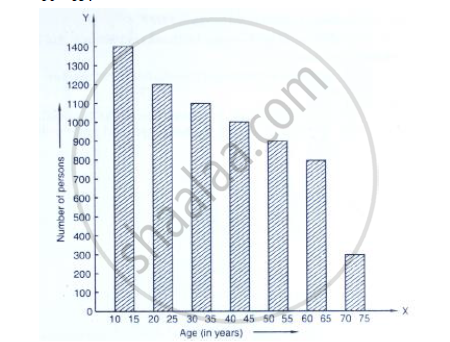
Study the bar graph representing the number of persons in various age groups in a town shown in Fig. below. Observe the bar graph and answer the following questions:
(i) What is the percentage of the youngest age-group persons over those in the oldest age group?
(ii) What is the total population of the town?
(iii) What is the number of persons in the age group 60 - 65?
(iv) How many persons are more in the age-group 10 - 15 than in the age group 30 - 35?
(v) What is the age-group of exactly 1200 persons living in the town?
(vi) What is the total number of persons living in the town in the age-group 50 - 55?
(vii) What is the total number of persons living in the town in the age-groups 10 - 15 and 60 - 65?

(viii) Whether the population in general increases, decreases or remains constant with the increase in the age-group.
The following table gives the route length (in thousand kilometres) of the Indian Railways in some of the years:
| Year | 1960-61 | 1970-71 | 1980-81 | 1990-91 | 2000-2001 |
| Route length (in thousand km) |
56 | 60 | 61 | 74 | 98 |
Represent the above data with the help of a bar graph.
The following data gives the amount of loans (in crores of rupees) disbursed by a bank during some years:
| Year | 1992 | 1993 | 1994 | 1995 | 1996 |
| Loan (in crores of rupees) |
28 | 33 | 55 | 55 | 80 |
(i) Represent the above data with the help of a bar graph.
(ii) With the help of the bar graph, indicate the year in which amount of loan is not increased over that of the preceding year.
The distribution of heights (in cm) of 96 children is given below. Construct a histogram and a frequency polygon on the same axes.
| Height (in cm): | 124 to 128 |
128 to 132 |
132 to 136 |
136 to 140 |
140 to 144 |
144 to 148 |
148 to 152 |
152 to 156 |
156 to 160 |
160 to 164 |
| No. of Children: | 5 | 8 | 17 | 24 | 16 | 12 | 6 | 4 | 3 | 1 |
A frequency polygon is constructed by plotting frequency of the class interval and the
In the 'less than' type of ogive the cumulative frequency is plotted against
In a histogram the class intervals or the group are taken along
Draw frequency polygons for each of the following frequency distribution:
(a) using histogram
(b) without using histogram
|
C.I |
10 - 30 |
30 - 50 |
50 - 70 | 70 - 90 | 90 - 110 | 110 - 130 | 130 - 150 |
| ƒ | 4 | 7 | 5 | 9 | 5 | 6 | 4 |
Manoj appeared for ICSE examination 2018 and secured percentage of marks as shown in the following table:
| Subject | Hindi | English | Maths | Science | Social Study |
| Marks as percent | 60 | 45 | 42 | 48 | 75 |
Represent the above data by drawing a suitable bar graph.
The following table gives the frequencies of most commonly used letters a, e, i, o, r, t, u from a page of a book:
| Letters | a | e | i | o | r | t | u |
| Frequency | 75 | 125 | 80 | 70 | 80 | 95 | 75 |
Represent the information above by a bar graph.
