Advertisements
Advertisements
प्रश्न
The distribution of heights (in cm) of 96 children is given below. Construct a histogram and a frequency polygon on the same axes.
| Height (in cm): | 124 to 128 |
128 to 132 |
132 to 136 |
136 to 140 |
140 to 144 |
144 to 148 |
148 to 152 |
152 to 156 |
156 to 160 |
160 to 164 |
| No. of Children: | 5 | 8 | 17 | 24 | 16 | 12 | 6 | 4 | 3 | 1 |
उत्तर
To represent the given data by a histogram, we first draw horizontal and vertical axes. Let us consider that the horizontal and vertical axes represent the class-limits and the frequencies of the class-intervals respectively.
The given data is a continuous grouped frequency distribution with equal class-intervals. Construct rectangles with class-intervals as bases and respective frequencies as heights.
To draw the frequency polygon of the given data using histogram, obtain the mid-points of the upper horizontal side of each rectangle and then join these mid-points of the adjacent rectangles of the histogram by line segments. Obtain the mid-points of two class-intervals of 0 frequencies, i.e. on the horizontal axis, one adjacent to the first, on its left and one adjacent to the last, on its right. These class-intervals are known as imagined class-intervals. Complete the polygon by joining the mid-points of first and last class-intervals to the mid-points of imagined class-intervals adjacent to them. Let us take one vertical division is equal to 4.
The heights of the different rectangles are as following
1. The height of the rectangle corresponding to the class-interval 124-128 is `5/4 = 1.25` big divisions.
2. The height of the rectangle corresponding to the class-interval 128-132 is ` 8/4`=2` big divisions.
3. The height of the rectangle corresponding to the class-interval 132-136 is `17/4 = 4.25` big divisions.
4. The height of the rectangle corresponding to the class-interval 136-140 is `24/4 = 6` big divisions.
5. The height of the rectangle corresponding to the class-interval 140-144 is `16/4 = 4` big divisions.
6. The height of the rectangle corresponding to the class-interval 144-148 is `12/4 = 3` big divisions.
7. The height of the rectangle corresponding to the class-interval 148-152 is `6/4 = 1.5` big divisions.
8. The height of the rectangle corresponding to the class-interval 152-156 is `4/4 =1 ` big divisions.
9. The height of the rectangle corresponding to the class-interval 156-160 is `3/4 = 0.75` big divisions.
10. The height of the rectangle corresponding to the class-interval 160-164 is `1/4 = 0.25 ` big divisions.
The histogram and frequency polygon of the given data is the following:

APPEARS IN
संबंधित प्रश्न
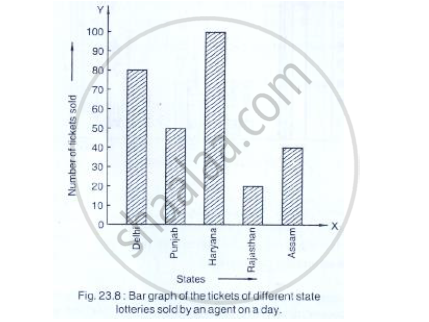
Read the bar graph shown in Fig. 23.8 and answer the following questions:

(i) What is the information given by the bar graph?
(ii) How many tickets of Assam State Lottery were sold by the agent?
(iii) Of which state, were the maximum number of tickets sold?
(iv) State whether true or false.
The maximum number of tickets sold is three times the minimum number of tickets sold.
(v) Of which state were the minimum number of tickets sold?
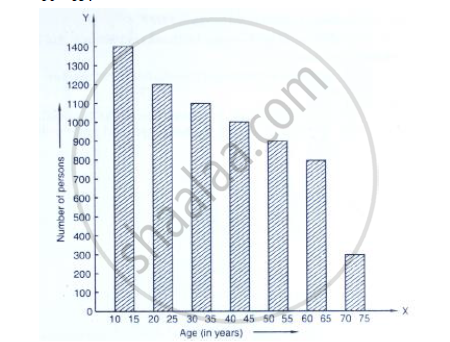
Study the bar graph representing the number of persons in various age groups in a town shown in Fig. below. Observe the bar graph and answer the following questions:
(i) What is the percentage of the youngest age-group persons over those in the oldest age group?
(ii) What is the total population of the town?
(iii) What is the number of persons in the age group 60 - 65?
(iv) How many persons are more in the age-group 10 - 15 than in the age group 30 - 35?
(v) What is the age-group of exactly 1200 persons living in the town?
(vi) What is the total number of persons living in the town in the age-group 50 - 55?
(vii) What is the total number of persons living in the town in the age-groups 10 - 15 and 60 - 65?

(viii) Whether the population in general increases, decreases or remains constant with the increase in the age-group.
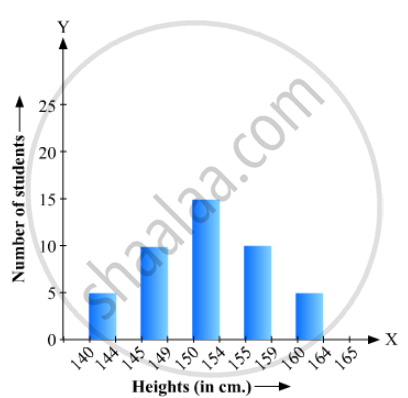
The following bar graph (Fig. 23. 1 4) represents the heights (in cm) of 50 students of Class XI of a particular school. Study the graph and answer the following questions:

(i) What percentage of the total number of students have their heights more than 149cm?
(ii) How many students in the class are in the range of maximum height of the class?
(iii) The school wants to provide a particular type of tonic to each student below the height
of 150 cm to improve his height. If the cost of the tonic for each student comes out to be Rs. 55, how much amount of money is required?
(iv) How many students are in the range of shortest height of the class?
(v) State whether true or false:
a. There are 9 students in the class whose heights are in the range of 155 - 159 cm.
b. Maximum height (in cm) of a student in the class is 17.
c. There are 29 students in the class whose heights are in the range of 145- 154 cm.
d. Minimum height (in cm) of a student is the class is in the range of 140 – 144 cms.
e. The number of students in the class having their heights less than 150 cm is 12.
f. There are 14 students each of whom has height more than 154. cm.
Read the following bar graph and answer the following questions:
(i) What information is given by the bar graph?
(ii) In which year the export is minimum?
(iii)In which year the import is maximum?
(iv)In which year the difference of the values of export and import is maximum?

The following table shows the daily production of T. V. sets in an industry for 7 days of a week:
| Day | Mon | Tue | Wed | Thurs | Fri | Sat | Sun |
| Number of T.V. Sets | 300 | 400 | 150 | 250 | 100 | 350 | 200 |
Represent the above information by a pictograph .
The following data shows the average age of men in various countries in a certain year:
| Country | India | Nepal | China | Pakistan | U.K | U.S.A |
| Average age (in years) |
55 | 52 | 60 | 50 | 70 | 75 |
Represent the above information by a bar graph.
The monthly profits (in Rs.) of 100 shops are distributed as follows:
| Profits per shop: | 0-50 | 50-100 | 100-50 | 150-200 | 200-250 | 250-300 |
| No. shops: | 12 | 18 | 27 | 20 | 17 | 6 |
Draw a histogram for the data and show the frequency polygon for it.
In the 'less than' type of ogive the cumulative frequency is plotted against
The birth rate thousand of the following states over a certain period is given below:
| States | Punjab | Haryana | U.P. | Gujarat | Rajasthan | Jammu and Kashmir |
| Birth Rate (per thousand ) | 22.9 | 21.8 | 19.5 | 21.1 | 23.9 | 18.3 |
Draw a bar graph for the above data.
Is it correct to say that in a histogram, the area of each rectangle is proportional to the class size of the corresponding class interval? If not, correct the statement.
