Advertisements
Advertisements
प्रश्न
What could be the reasons of lower sex ratio in any region?
उत्तर
Sex ratio refers to the number of females per thousand males in a region. India has a low sex ratio.
The reasons for lower sex ratio are as follows:
- Illiteracy: People are not aware of the role of women in modern society. This is because of child marriages where girls get married at an early age without having a chance to study and educate themselves.
- Female infanticide: Even though the Government has passed many Acts to stop this inhuman act, people still prefer to have a male child due to many reasons. Hence, girl babies are killed as soon as they are born.
- Domestic violence: Women are considered to be the weaker sex and hence crimes and violence against women is still a common feature in many of the rural households. This makes even the mother stop having a girl child.
- Female foeticide: Due to socio-economic issues like dowry, people destroy the girl foetus in the womb itself. Many laws have been made to prevent this.
- Poverty: Poverty is a major reason for the declining sex ratio. Families living under Below Poverty Line(BPL) generally do not want to have girl children.
- Lack of women empowerment: Due to lack of education, women do not enjoy equal opportunities in many of the rural areas, especially in northern India.
The lower sex ratio, even in the twenty-first century is really a cause of concern.
संबंधित प्रश्न
Answer the following in detail.
Explain - The growth rate of population in India is decreasing but population is increasing.
The average life expectancy in India is increasing.
Explain the similarities and differences between the population distribution in Brazil and India.
Giving examples, correlate climate and population distribution.
- Compare and classify the population densities shown in the squares ‘a’ and
‘b’ representing 1 sq.km of area. - If in figure B, one sign = 100, then what will be the sex ratio?
(a)
(b)
What should be done so that our manpower is utilized properly, sex ratio improves and population growth is controlled? Write two to three sentences on each.
Number of females _________ males in a region is known as sex ratio.
Observe the following graph and answer the given questions:
Life Expectancy :

- What is the average life expectancy in India in the year 2016?
- In the year 1990, how much was an increase in life expectancy in Brazil as compared to India ?
- How much was the average life expectancy in 1980 in India, during which year do you find the same in Brazil ?
- Which country shows an increase in life expectancy during the period from 2010 to 2016 ?
- In which country do you find high life expectancy ?
- By how much was India's life expectancy lesser than Brazil in the year 1960?
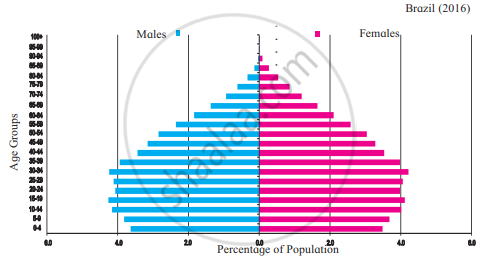
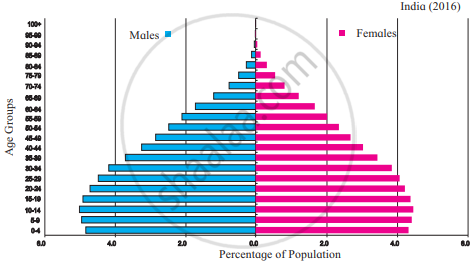
Observe the following graphs and answer the questions given below:


- In which country is the number of female is more in the age group 15-19 years?
- In which country do you find a higher percentage of the population belonging to the age group 80 + years?
- In which country is the number of children of age group 0-4 years more?
- In Brazil, which age group has the highest population.?
- While comparing the age-sex pyramids, which pyramid has a broader base?
- In which country is the proportion of the population belonging to the age group less than 15 years lesser?
If the proportion of dependent age groups increases in the composition of population, how will it affect the economy of a country?
