Advertisements
Advertisements
प्रश्न
What could be the reasons of lower sex ratio in any region?
उत्तर
Sex ratio refers to the number of females per thousand males in a region. India has a low sex ratio.
The reasons for lower sex ratio are as follows:
- Illiteracy: People are not aware of the role of women in modern society. This is because of child marriages where girls get married at an early age without having a chance to study and educate themselves.
- Female infanticide: Even though the Government has passed many Acts to stop this inhuman act, people still prefer to have a male child due to many reasons. Hence, girl babies are killed as soon as they are born.
- Domestic violence: Women are considered to be the weaker sex and hence crimes and violence against women is still a common feature in many of the rural households. This makes even the mother stop having a girl child.
- Female foeticide: Due to socio-economic issues like dowry, people destroy the girl foetus in the womb itself. Many laws have been made to prevent this.
- Poverty: Poverty is a major reason for the declining sex ratio. Families living under Below Poverty Line(BPL) generally do not want to have girl children.
- Lack of women empowerment: Due to lack of education, women do not enjoy equal opportunities in many of the rural areas, especially in northern India.
The lower sex ratio, even in the twenty-first century is really a cause of concern.
संबंधित प्रश्न
Answer the following in detail.
Explain - The growth rate of population in India is decreasing but population is increasing.
Identify the wrong pair.
State and population density
i) Sao Paulo – Dense
ii) Himachal Pradesh – dense
iii) Amazonas – Sparse
iv) West Bengal – Dense
Explain the similarities and differences between the population distribution in Brazil and India.
Giving examples, correlate climate and population distribution.
- Compare and classify the population densities shown in the squares ‘a’ and
‘b’ representing 1 sq.km of area. - If in figure B, one sign = 100, then what will be the sex ratio?
(a)
(b)
Expectancy of life is still less in developing countries.
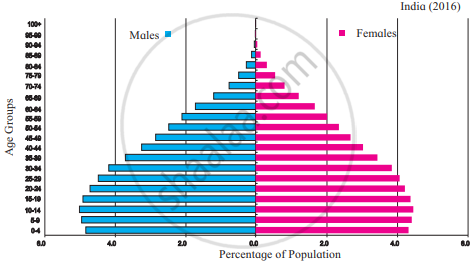
Observe the following graph and answer the questions given below-
India- % of population (2016)

- Which type of graph is this?
- Which age group has the highest population?
- Write class interval of age groups given on Y-axis.
- Whose number is more in males and females of age above 60?
- How much percent of females are found in age group of 55 to 59 years?
- After which age group is the decrease in population found?
Prepare a simple bar graph with the help of given statistical information and answer the questions given below-
Brazil-life expectancy
| Years | Life expectancy |
| 1960 | 54 |
| 1970 | 59 |
| 1980 | 61 |
| 1990 | 65 |
| 2000 | 70 |
| 2010 | 73 |
| 2016 | 75 |
Questions-
- What is the interval of years in the data?
- What is the difference in life expectancy of 1960 and 2016?
- Write five sentences about the analysis of graph.
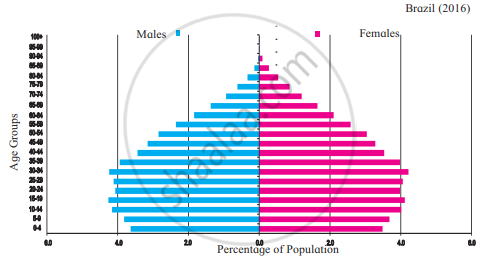
Observe the following graphs and answer the questions given below:


- In which country is the number of female is more in the age group 15-19 years?
- In which country do you find a higher percentage of the population belonging to the age group 80 + years?
- In which country is the number of children of age group 0-4 years more?
- In Brazil, which age group has the highest population.?
- While comparing the age-sex pyramids, which pyramid has a broader base?
- In which country is the proportion of the population belonging to the age group less than 15 years lesser?
With the help of given statistical data, prepare a simple bar graph and answer the following questions.
| Year | Percentage % of Urban Population in India |
| 1961 | 18.0 |
| 1971 | 18.2 |
| 1981 | 23.3 |
| 1991 | 25.7 |
| 2001 | 27.8 |
| 2011 | 31.2 |
- Mention the year m which the percentage of urban population in India was 18?
- By how many percent did the percentage of urban population increase in decade 2001 to 2011?
- In which decade was the percent growth in urban population highest?
