Advertisements
Advertisements
प्रश्न
Prepare a simple bar graph with the help of given statistical information and answer the questions given below-
Brazil-life expectancy
| Years | Life expectancy |
| 1960 | 54 |
| 1970 | 59 |
| 1980 | 61 |
| 1990 | 65 |
| 2000 | 70 |
| 2010 | 73 |
| 2016 | 75 |
Questions-
- What is the interval of years in the data?
- What is the difference in life expectancy of 1960 and 2016?
- Write five sentences about the analysis of graph.
उत्तर

- The interval of the data is 10 years.
- The difference in life expectancy of 1960 and 2016 is 21 years.
- i. Life expectancy is an average number of years a person born in a country is expected to live.
ii. The graph shows that life expectancy has increased in every decade.
iii. The life expectancy has increased by 21 years from 1960 to 2016.
iv. The mortality rate has reduced in the last 56 years.
v. The life expectancy has increased due to improvement in medical facilities, progress in the medical field, access to nutritious food etc.
संबंधित प्रश्न
The average life expectancy in India is increasing.
Identify the wrong pair.
State and population density
i) Sao Paulo – Dense
ii) Himachal Pradesh – dense
iii) Amazonas – Sparse
iv) West Bengal – Dense
Explain the reasons of low sex ratio in India.
Observe the following graphs and answer the questions given below them:


(1) What do the above graphs show?
(2) Which country has highest male population?
(3) Which country has highest female population?
(4) Which country has rapid increase in female population after 2001?

(5) What was the female population in India in 1961?
(6) Which country has more than 1000 female population?
Is the following sentence right or wrong? Correct the wrong one.
The life expectancy of Indians is decreasing.
Classify the factors affecting the distribution of population into favourable and unfavourable. Nearness to sea, lack of roads, temperate climate, lack of industries, new cities and towns, tropical moist forests, minerals, semi-arid climate, cultivable land.
- Compare and classify the population densities shown in the squares ‘a’ and
‘b’ representing 1 sq.km of area. - If in figure B, one sign = 100, then what will be the sex ratio?
(a)
(b)
What is the sex ratio?
Observe the following graph and answer the questions given below:
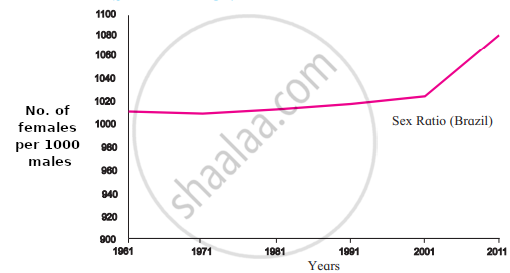

- What does the sex ratio of India indicate ?
- Since when has the sex ratio in India increased?
- What was the condition of sex ratio in India in 1961-71?
- What does sex ratio mean?
- What does the sex ratio of Brazil indicate?
- In which year did the women outnumber men in considerable amount in Brazil?
Is there a relationship between increase in life expectancy and growth of population? If yes, how?
