Advertisements
Advertisements
Question
Prepare a simple bar graph with the help of given statistical information and answer the questions given below-
Brazil-life expectancy
| Years | Life expectancy |
| 1960 | 54 |
| 1970 | 59 |
| 1980 | 61 |
| 1990 | 65 |
| 2000 | 70 |
| 2010 | 73 |
| 2016 | 75 |
Questions-
- What is the interval of years in the data?
- What is the difference in life expectancy of 1960 and 2016?
- Write five sentences about the analysis of graph.
Solution

- The interval of the data is 10 years.
- The difference in life expectancy of 1960 and 2016 is 21 years.
- i. Life expectancy is an average number of years a person born in a country is expected to live.
ii. The graph shows that life expectancy has increased in every decade.
iii. The life expectancy has increased by 21 years from 1960 to 2016.
iv. The mortality rate has reduced in the last 56 years.
v. The life expectancy has increased due to improvement in medical facilities, progress in the medical field, access to nutritious food etc.
RELATED QUESTIONS
Explain the reasons of low sex ratio in India.
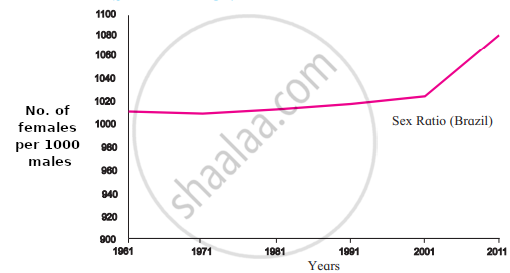
Observe the following graphs and answer the questions given below them:


(1) What do the above graphs show?
(2) Which country has highest male population?
(3) Which country has highest female population?
(4) Which country has rapid increase in female population after 2001?

(5) What was the female population in India in 1961?
(6) Which country has more than 1000 female population?
Is the following sentence right or wrong? Correct the wrong one.
The life expectancy of Indians is decreasing.
Giving examples, correlate climate and population distribution.
- Compare and classify the population densities shown in the squares ‘a’ and
‘b’ representing 1 sq.km of area. - If in figure B, one sign = 100, then what will be the sex ratio?
(a)
(b)
What should be done so that our manpower is utilized properly, sex ratio improves and population growth is controlled? Write two to three sentences on each.
Number of females _________ males in a region is known as sex ratio.
Distinguish between
Average life expectancy in India and Brazil
Observe the following graph and answer the questions given below-
Brazil- % of population (2016)

- Which type of graph is this?
- Which age group has the highest population?
- Write class interval of age groups given on Y-axis.
- Whose number is more in males and females of age above 60?
- How much percent of females are found in age group of 55 to 59 years?
- After which age group is the decrease in population found?
Observe the following graph and answer the questions given below:

- What does the sex ratio of India indicate ?
- Since when has the sex ratio in India increased?
- What was the condition of sex ratio in India in 1961-71?
- What does sex ratio mean?
- What does the sex ratio of Brazil indicate?
- In which year did the women outnumber men in considerable amount in Brazil?
