Advertisements
Advertisements
Question
What should be done so that our manpower is utilized properly, sex ratio improves and population growth is controlled? Write two to three sentences on each.
Solution
Manpower refers to the human resource of a country. The higher the population, the greater the manpower. The increased population can be a great asset if it is used properly and productively.
Steps to utilize manpower:
- Providing education and improving the standard of education enables the people of a country to gain appropriate skills and knowledge.
- Based on the skills, the manpower can be classified as skilled and unskilled sector and can be placed in various industries.
- Providing basic health facilities to all sections of labourers aid in increased productivity and prevents employees refraining from work due to health issues.
- In large scale sectors, many training programmes can be conducted to improve the talent hidden in the employees.
The number of females per thousand men is referred to as the Sex ratio. Generally, in a country like India, the sex ratio is very poor.
Steps to improve sex ratio:
- Educating and creating awareness among the masses about the role of women in the development of a country may improve the sex ratio.
- Making sure that the laws against female foeticide and infanticide are followed properly.
- Preventing child marriages to avoid the mortality of young girls.
- Granting equal rights to women and making them enjoy equal opportunities on par with men.
- Increasing the self-esteem of women through education, employment and independence.
Increasing population is always a concern and poses a serious threat to the economic development of the country.
Steps to control population:
- Making people, especially the rural masses understand the problems faced due to increased population.
- Adopting various birth control methods.
- Providing education and eradication of poverty which indirectly helps in population control. An educated person can understand the consequences of having too many children. Similarly, if poverty is eradicated, there will be an end to child labour. Child labour persuades a poor man to have children and send them to jobs to earn for himself and his family.
These are some of the steps that can be taken to utilize manpower, improve the sex ratio and control the population of a country.
APPEARS IN
RELATED QUESTIONS
Read the following graph and answer the questions
India and Brazil Literacy Rate (%)
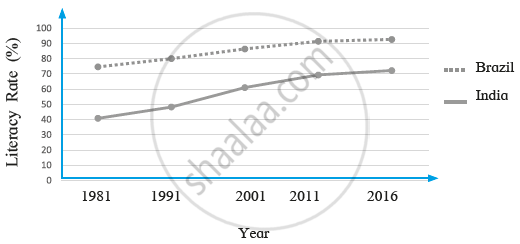
i) What was the literacy rate in Brazil in 2001?
ii) In which decade did the literacy rate increase the most in India?
iii) What is the difference between the literacy rates of India and Brazil in 1991?
iv) By how much has the literacy rate increased in India between 1981- 2016?
v) How much is the interval generally used in the graph?
vi) What conclusions can you draw from the graph regarding the literacy rates of India and Brazil?
With the help of given statistical data prepare a simple bar graph and answer the following questions:
India – Trend of Urbanisation (1961-2011)
| Year | Percentage of Urban Population |
| 1961 | 18.0 |
| 1971 | 18.2 |
| 1981 | 23.3 |
| 1991 | 25.7 |
| 2001 | 27.8 |
| 2011 | 31.2 |
(1) What is the interval of the data?
(2) Which decade shows slow rate of urbanisation?
(3) Which decade shows high rate of urbanisation?
Giving examples, correlate climate and population distribution.
Distinguish between
Average life expectancy in India and Brazil
Observe the following graph and answer the given questions:
Life Expectancy :

- What is the average life expectancy in India in the year 2016?
- In the year 1990, how much was an increase in life expectancy in Brazil as compared to India ?
- How much was the average life expectancy in 1980 in India, during which year do you find the same in Brazil ?
- Which country shows an increase in life expectancy during the period from 2010 to 2016 ?
- In which country do you find high life expectancy ?
- By how much was India's life expectancy lesser than Brazil in the year 1960?
With the help of given statistical data, prepare a simple bar graph and answer the following questions.
| Year | Percentage % of Urban Population in India |
| 1961 | 18.0 |
| 1971 | 18.2 |
| 1981 | 23.3 |
| 1991 | 25.7 |
| 2001 | 27.8 |
| 2011 | 31.2 |
- Mention the year m which the percentage of urban population in India was 18?
- By how many percent did the percentage of urban population increase in decade 2001 to 2011?
- In which decade was the percent growth in urban population highest?
Observe the following graph and answer the questions given below:
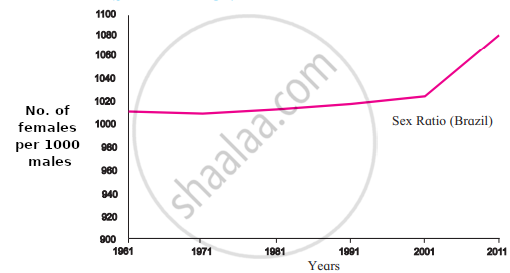

- What does the sex ratio of India indicate ?
- Since when has the sex ratio in India increased?
- What was the condition of sex ratio in India in 1961-71?
- What does sex ratio mean?
- What does the sex ratio of Brazil indicate?
- In which year did the women outnumber men in considerable amount in Brazil?
Is there a relationship between increase in life expectancy and growth of population? If yes, how?
If the proportion of dependent age groups increases in the composition of population, how will it affect the economy of a country?
With the help of given statistical data, prepare a simple bar graph and answer the following questions:
| Life Expectancy - India | |
| Years | Life Expectancy |
| 1980 | 54 |
| 1990 | 58 |
| 2000 | 63 |
| 2010 | 67 |
| 2016 | 68 |
- In the year 1990, what is the average life expectancy?
- In which two decades, the average life expectancy is found to be similar increase?
- How much increase can be seen in the life expectancy from 1990 to 2016?
