Advertisements
Advertisements
Question
Read the following graph and answer the questions
India and Brazil Literacy Rate (%)
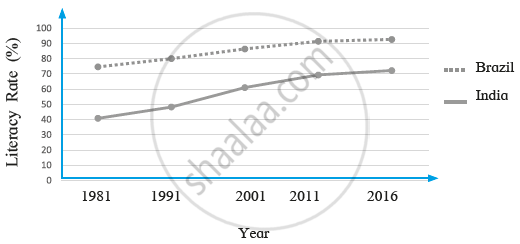
i) What was the literacy rate in Brazil in 2001?
ii) In which decade did the literacy rate increase the most in India?
iii) What is the difference between the literacy rates of India and Brazil in 1991?
iv) By how much has the literacy rate increased in India between 1981- 2016?
v) How much is the interval generally used in the graph?
vi) What conclusions can you draw from the graph regarding the literacy rates of India and Brazil?
Solution
i) - 85%
ii) - 1991-2001
iii) - 30%
iv) - 30%
v) - 10 years
vi) Points - Brazil has a higher literacy rate than India
- increasing every decade
RELATED QUESTIONS
Explain the reasons of low sex ratio in India.
Is the following sentence right or wrong? Correct the wrong one.
The life expectancy of Indians is decreasing.
Explain the similarities and differences between the population distribution in Brazil and India.
Giving examples, correlate climate and population distribution.
What could be the reasons of lower sex ratio in any region?
Number of females _________ males in a region is known as sex ratio.
Prepare a simple bar graph with the help of given statistical information and answer the questions given below-
Brazil-life expectancy
| Years | Life expectancy |
| 1960 | 54 |
| 1970 | 59 |
| 1980 | 61 |
| 1990 | 65 |
| 2000 | 70 |
| 2010 | 73 |
| 2016 | 75 |
Questions-
- What is the interval of years in the data?
- What is the difference in life expectancy of 1960 and 2016?
- Write five sentences about the analysis of graph.
With the help of given statistical data, prepare a simple bar graph and answer the following questions.
| Year | Percentage % of Urban Population in India |
| 1961 | 18.0 |
| 1971 | 18.2 |
| 1981 | 23.3 |
| 1991 | 25.7 |
| 2001 | 27.8 |
| 2011 | 31.2 |
- Mention the year m which the percentage of urban population in India was 18?
- By how many percent did the percentage of urban population increase in decade 2001 to 2011?
- In which decade was the percent growth in urban population highest?
Is there a relationship between increase in life expectancy and growth of population? If yes, how?
With the help of given statistical data, prepare a simple bar graph and answer the following questions:
| Life Expectancy - India | |
| Years | Life Expectancy |
| 1980 | 54 |
| 1990 | 58 |
| 2000 | 63 |
| 2010 | 67 |
| 2016 | 68 |
- In the year 1990, what is the average life expectancy?
- In which two decades, the average life expectancy is found to be similar increase?
- How much increase can be seen in the life expectancy from 1990 to 2016?
