Advertisements
Advertisements
Question
Explain the similarities and differences between the population distribution in Brazil and India.
Solution
Similarities:
- In both Brazil and India, the population is unevenly distributed depending on the physiography with densely forested areas having lesser density.
- Brazil is least populated around the Amazon basin while India is least populated along with the Himalayan mountain range.
Differences:
- India is the second most populated country in the world while Brazil is the fifth.
- The highest concentration of the population in India is in the northern plains while Brazil is the southeastern coastal lowlands.
RELATED QUESTIONS
The average life expectancy in India is increasing.
Explain the reasons of low sex ratio in India.
Is the following sentence right or wrong? Correct the wrong one.
The life expectancy of Indians is decreasing.
Classify the factors affecting the distribution of population into favourable and unfavourable. Nearness to sea, lack of roads, temperate climate, lack of industries, new cities and towns, tropical moist forests, minerals, semi-arid climate, cultivable land.
What is the sex ratio?
Observe the following graphs and answer the questions given below:
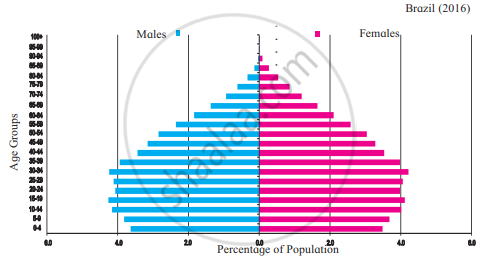
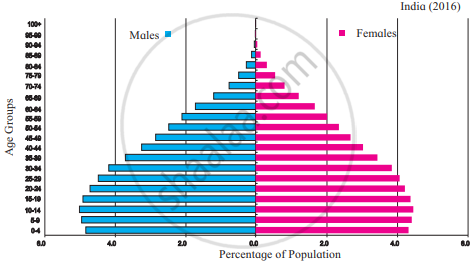
- In which country is the number of female is more in the age group 15-19 years?
- In which country do you find a higher percentage of the population belonging to the age group 80 + years?
- In which country is the number of children of age group 0-4 years more?
- In Brazil, which age group has the highest population.?
- While comparing the age-sex pyramids, which pyramid has a broader base?
- In which country is the proportion of the population belonging to the age group less than 15 years lesser?
With the help of given statistical data, prepare a simple bar graph and answer the following questions.
| Year | Percentage % of Urban Population in India |
| 1961 | 18.0 |
| 1971 | 18.2 |
| 1981 | 23.3 |
| 1991 | 25.7 |
| 2001 | 27.8 |
| 2011 | 31.2 |
- Mention the year m which the percentage of urban population in India was 18?
- By how many percent did the percentage of urban population increase in decade 2001 to 2011?
- In which decade was the percent growth in urban population highest?
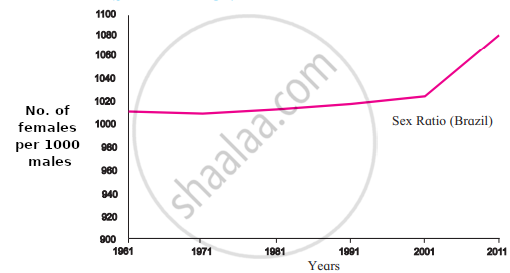
Observe the following graph and answer the questions given below:

- What does the sex ratio of India indicate ?
- Since when has the sex ratio in India increased?
- What was the condition of sex ratio in India in 1961-71?
- What does sex ratio mean?
- What does the sex ratio of Brazil indicate?
- In which year did the women outnumber men in considerable amount in Brazil?
Is there a relationship between increase in life expectancy and growth of population? If yes, how?
If the proportion of dependent age groups increases in the composition of population, how will it affect the economy of a country?
