Advertisements
Advertisements
Question
Giving examples, correlate climate and population distribution.
Solution 1
The relation between climate and population:
- High rainfall causes growth of dense forests where human settlements are very less, like the Amazon basin in Brazil and north-eastern states in India.
- Extreme climatic conditions like arid and cold areas reduce the human population. For example, savannah in Brazil and high altitudes of the Himalayas in India are less populated.
- Areas with a climate that supports agriculture are most populated, like northern plains in India and coastal lowlands in Brazil.
- Areas with moderate climate are also well populated, like the deciduous and coastal areas.
Solution 2
In order to survive, human beings need suitable and conducive climate; as these are one of the most essential factors. For e.g.:
- The south-eastern coastal areas of Brazil receive 1000 - 1200 mm of rainfall and rarely experience tropical cyclones. Due to this, agriculture and industries have flourished well here. Due to this, a higher density of population is found in these areas.
- In India, the northern plains and the coastal areas in the west and east have favourable climate, which results in the concentration of population in these areas.
Also, it is to be noted that human settlements are not dense in areas having rain shadow regions, dry weather or extremely heavy rainfall, high temperature, etc. For e.g.:
- In Brazil, a sparse population is found in the north-eastern part of the highlands which are drought-affected and the areas of the Amazon valley that have unfavourable climate, experiences heavy rainfall, have accessibility issues and dense forests.
- In India, a sparse population is found in the western desert occupied areas of Rajasthan, where the soil is not suitable for cultivation and the climate is very dry. Similarly, a sparse population is also found in the areas of high altitude like the Himalayas where the temperature is as low as – 40° (minus forty degrees).
Thus, it is evident that, climate plays a very important role in population concentration.
APPEARS IN
RELATED QUESTIONS
Read the following graph and answer the questions
India and Brazil Literacy Rate (%)
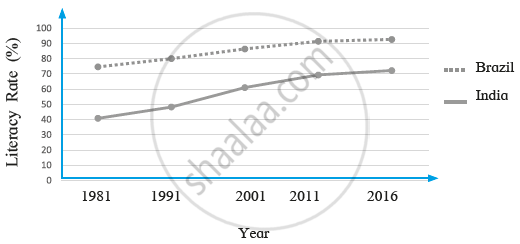
i) What was the literacy rate in Brazil in 2001?
ii) In which decade did the literacy rate increase the most in India?
iii) What is the difference between the literacy rates of India and Brazil in 1991?
iv) By how much has the literacy rate increased in India between 1981- 2016?
v) How much is the interval generally used in the graph?
vi) What conclusions can you draw from the graph regarding the literacy rates of India and Brazil?
With the help of given statistical data prepare a simple bar graph and answer the following questions:
India – Trend of Urbanisation (1961-2011)
| Year | Percentage of Urban Population |
| 1961 | 18.0 |
| 1971 | 18.2 |
| 1981 | 23.3 |
| 1991 | 25.7 |
| 2001 | 27.8 |
| 2011 | 31.2 |
(1) What is the interval of the data?
(2) Which decade shows slow rate of urbanisation?
(3) Which decade shows high rate of urbanisation?
Classify the factors affecting the distribution of population into favourable and unfavourable. Nearness to sea, lack of roads, temperate climate, lack of industries, new cities and towns, tropical moist forests, minerals, semi-arid climate, cultivable land.
What is the sex ratio?
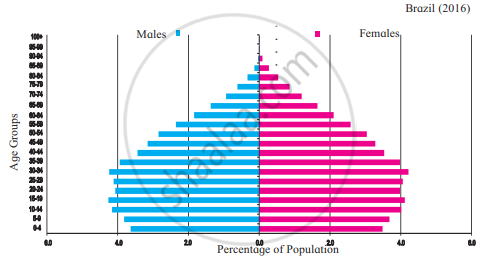
Observe the following graph and answer the questions given below-
Brazil- % of population (2016)

- Which type of graph is this?
- Which age group has the highest population?
- Write class interval of age groups given on Y-axis.
- Whose number is more in males and females of age above 60?
- How much percent of females are found in age group of 55 to 59 years?
- After which age group is the decrease in population found?
Prepare a simple bar graph with the help of given statistical information and answer the questions given below-
Brazil-life expectancy
| Years | Life expectancy |
| 1960 | 54 |
| 1970 | 59 |
| 1980 | 61 |
| 1990 | 65 |
| 2000 | 70 |
| 2010 | 73 |
| 2016 | 75 |
Questions-
- What is the interval of years in the data?
- What is the difference in life expectancy of 1960 and 2016?
- Write five sentences about the analysis of graph.
Observe the following graphs and answer the questions given below:
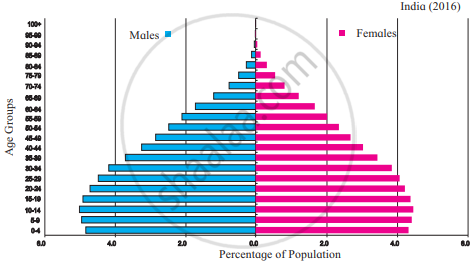
- In which country is the number of female is more in the age group 15-19 years?
- In which country do you find a higher percentage of the population belonging to the age group 80 + years?
- In which country is the number of children of age group 0-4 years more?
- In Brazil, which age group has the highest population.?
- While comparing the age-sex pyramids, which pyramid has a broader base?
- In which country is the proportion of the population belonging to the age group less than 15 years lesser?
Observe the following graph and answer the questions given below:
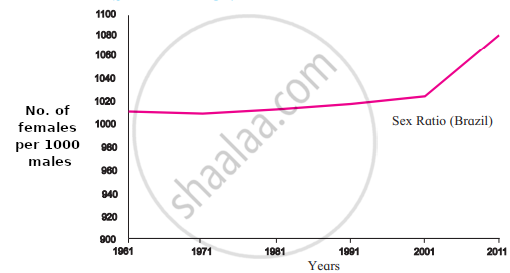

- What does the sex ratio of India indicate ?
- Since when has the sex ratio in India increased?
- What was the condition of sex ratio in India in 1961-71?
- What does sex ratio mean?
- What does the sex ratio of Brazil indicate?
- In which year did the women outnumber men in considerable amount in Brazil?
Is there a relationship between increase in life expectancy and growth of population? If yes, how?
If the proportion of dependent age groups increases in the composition of population, how will it affect the economy of a country?
