Advertisements
Advertisements
प्रश्न
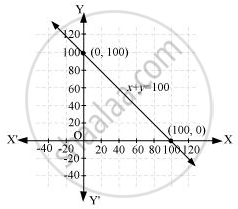
Yamini and Fatima, two students of Class IX of a school, together contributed Rs. 100 towards the Prime Minister’s Relief Fund to help the earthquake victims. Write a linear equation which satisfies this data. (You may take their contributions as Rs. x and Rs. y.) Draw the graph of the same.
उत्तर
Let the amount that Yamini and Fatima contributed be x and y respectively towards the Prime Minister’s Relief fund.
Amount contributed by Yamini + Amount contributed by Fatima = 100
x + y = 100
It can be observed that (100, 0) and (0, 100) satisfy the above equation. Therefore, these are the solutions of the above equation. The graph is constructed as follows.

Here, it can be seen that variable x and y are representing the amount contributed by Yamini and Fatima respectively and these quantities cannot be negative. Hence, only those values of x and y which are lying in the 1st quadrant will be considered.
APPEARS IN
संबंधित प्रश्न
Give the equations of two lines passing through (2, 14). How many more such lines are there, and why?
The taxi fare in a city is as follows:- For the first kilometre, the fare is Rs. 8 and for the subsequent distance it is Rs. 5 per km. Taking the distance covered as x km and total fare as Rs y, write a linear equation for this information, and draw its graph.
Draw the graph of the following linear equation in two variable : –x + y = 6
Draw the graph of the following linear equation in two variable : ` x / 2 - y/ 3 = 2`
From the choices given below, choose the equation whose graph is given in Fig. below.
(i) y = x (ii) x + y = 0 (iii) y = 2x (iv) 2 + 3y = 7x

[Hint: Clearly, (-1, 1) and (1, -1) satisfy the equation x + y = 0]
If the point (2, -2) lies on the graph of the linear equation 5x + ky = 4, find the value of k.
Draw the graph for the equation, given below :
y + 7 = 0
The graph given below represents the linear equation x = 3 (see figure).

The following observed values of x and y are thought to satisfy a linear equation. Write the linear equation:
| x | 6 | – 6 |
| y | –2 | 6 |
Draw the graph using the values of x, y as given in the above table. At what points the graph of the linear equation cuts the y-axis
The force exerted to pull a cart is directly proportional to the acceleration produced in the body. Express the statement as a linear equation of two variables and draw the graph of the same by taking the constant mass equal to 6 kg. Read from the graph, the force required when the acceleration produced is (i) 5 m/sec2, (ii) 6 m/sec2.
