Advertisements
Advertisements
There are three boys and two girls. A committee of two is to be formed. Find the probability of the following events:
Event A: The committee contains at least one girl
Event B: The committee contains one boy and one girl
Concept: Basic Ideas of Probability
Two digit numbers are formed using the digits 0, 1, 2, 3, 4, 5 where digits are not repeated.
P is the event that the number so formed is even.
Q is the event that the number so formed is greater than 50.
R is the event that the number so formed is divisible by 3.
Then write the sample space S and events P, Q, R using set notation.
Concept: Basic Ideas of Probability
Two coins are tossed simultaneously. Write the sample space ‘S’ and the number of sample points n(S). Write the following events using set notation and mention the number of elements in each of them:-
(a) A is the event of getting at least one head.
(b) B is the event of getting exactly one head
Concept: Basic Ideas of Probability
Two dice are thrown. Find the probability of getting :
1) The sum of the numbers on their upper faces is at least 9.
2) The sum of the numbers on their upper faces is 15.
3) The number on the upper face of the second die is greater than the number on the upper face of the first die.
Concept: Basic Ideas of Probability
A balloon vendor has 2 red, 3 blue and 4 green balloons. He wants to choose one of them at random to give it to Pranali. What is the probability of the event that Pranali gets, a blue balloon.
Concept: Basic Ideas of Probability
If one die is rolled, then find the probability of the following event by completing the activity.
Event A: The number on the upper face is prime.
Activity: Let ‘S’ be the sample space.
S = {1, 2, 3, 4, 5, 6}
∴ n(S) = 6
Event A: Prime number on the upper face.
A = {`square`}
∴ n(A) = 3
P(A) = `square/(n(S))` .....[Formula]
= `square/6`
∴ P(A) = `1/square`
Concept: Probability of an Event
There are 30 cards in a box, each bearing one of the numbers from 1 to 30. One card is drawn at random from the box. Find the probability of event that the card drawn shows a number which is a multiple of 5
Concept: Probability of an Event
The measurements (in mm) of the diameters of the head of the screws are given below:
| Diameter (in mm) | No. of Screws |
| 33 — 35 | 10 |
| 36 — 38 | 19 |
| 39 — 41 | 23 |
| 42 — 44 | 21 |
| 45 — 47 | 27 |
Calculate mean diameter of head of a screw by ‘Assumed Mean Method’.
Concept: Mean of Grouped Data
The marks scored by students in Mathematics in a certain Examination are given below:
| Marks Scored | Number of Students |
| 0 — 20 | 3 |
| 20 — 40 | 8 |
| 40 — 60 | 19 |
| 60 — 80 | 18 |
| 80 — 100 | 6 |
Draw histogram for the above data.
Concept: Graphical Representation of Data as Histograms
Draw the frequency polygon for the following frequency distribution
| Rainfall (in cm) | No. of Years |
| 20 — 25 | 2 |
| 25 — 30 | 5 |
| 30 — 35 | 8 |
| 35 — 40 | 12 |
| 40 — 45 | 10 |
| 45 — 50 | 7 |
Concept: Graphical Representation of Data as Histograms
The following table shows ages of 3000 patients getting medical treatment in a hospital on a particular day :
| Age (in years) | No. of Patients |
| 10-20 | 60 |
| 20-30 | 42 |
| 30-40 | 55 |
| 40-50 | 70 |
| 50-60 | 53 |
| 60-70 | 20 |
Find the median age of the patients.
Concept: Median of Grouped Data
Given below is the frequency distribution of driving speeds (in km/hour) of the vehicles of 400 college students:
| Speed (in km/hr) | No. of Students |
| 20-30 | 6 |
| 30-40 | 80 |
| 40-50 | 156 |
| 50-60 | 98 |
60-70 |
60 |
Draw Histogram and hence the frequency polygon for the above data.
Concept: Graphical Representation of Data as Histograms
If `sumf_ix_i=75 and sumfi=15` , then find the mean x .
Concept: Median of Grouped Data
For a certain frequency distribution, the value of mean is 20 and mode is 11. Find the value of median.
Concept: Median of Grouped Data
Represent the following data by Histogram:
|
Price of Sugar per kg (in Rs.) |
Number of Weeks |
| 18-20 | 4 |
| 20-22 | 8 |
| 22-24 | 22 |
| 24-26 | 12 |
| 26-28 | 8 |
| 28-30 | 6 |
Concept: Graphical Representation of Data as Histograms
The sales of salesmen in a week are given in the pie diagram. Study the diagram and answer the following questions. If the total sale due to salesmen A is Rs. 18,000, then
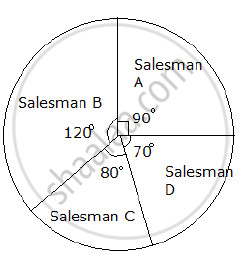
a) Find the total sale.
b) Find the sale of each salesman.
c) Find the salesman with the highest sale.
d) Find the difference between the highest sale and the lowest sale.
Concept: Concept of Pie Graph (Or a Circle-graph)
The following is the distribution of the size of certain farms from a taluka (tehasil):
| Size of Farms (in acres) |
Number of Farms |
| 5 – 15 | 7 |
| 15 – 25 | 12 |
| 25 – 35 | 17 |
| 35 – 45 | 25 |
| 45 – 55 | 31 |
| 55 – 65 | 5 |
| 65 – 75 | 3 |
Find median size of farms.
Concept: Median of Grouped Data
For a certain frequency distribution, the values of mean and median are 72 and 78 respectively. Find the value of mode.
Concept: Median of Grouped Data
Find the correct answer from the alternatives given.
The persons of O - blood group are 40%. The classification of persons based on blood groups is to be shown by a pie diagram. What should be the measures of angle for the persons of O - blood group?
Concept: Concept of Pie Graph (Or a Circle-graph)
The following table shows the income of farmers in a grape season. Find the mean of their income.
|
Income
(Thousand Rupees)
|
20 - 30 | 30 - 40 | 40 - 50 | 50 - 60 | 60 - 70 | 70 - 80 |
| Farmers | 10 | 11 | 15 | 16 | 18 | 14 |
Concept: Mean of Grouped Data
