Advertisements
Advertisements
प्रश्न
For a certain frequency distribution, the value of mean is 20 and mode is 11. Find the value of median.
उत्तर
The inter-relation between the measures of central tendency is given by
Mean – Mode = 3(Mean-Median)
20 – 11 = 3 (20-Median)
9 = 3 (20-Median)
9/3= 20-Median
3=20 -Median
median =20-3
Median = 17
संबंधित प्रश्न
The numbers 6, 8, 10, 12, 13 and x are arranged in an ascending order. If the mean of the observations is equal to the median, find the value of x
Calculate the median from the following data:
| Rent (in Rs.): | 15 - 25 | 25 - 35 | 35 - 45 | 45 - 55 | 55 - 65 | 65 - 75 | 75 - 85 | 85 - 95 |
| No. of Houses: | 8 | 10 | 15 | 25 | 40 | 20 | 15 | 7 |
If the median of the following data is 32.5, find the missing frequencies.
| Class interval: | 0 - 10 | 10 - 20 | 20 - 30 | 30 - 40 | 40 - 50 | 50 - 60 | 60 - 70 | Total |
| Frequency: | f1 | 5 | 9 | 12 | f2 | 3 | 2 | 40 |
Compute the median for the following data:
| Marks | No. of students |
| More than 150 | 0 |
| More than 140 | 12 |
| More than 130 | 27 |
| More than 120 | 60 |
| More than 110 | 105 |
| More than 100 | 124 |
| More than 90 | 141 |
| More than 80 | 150 |
From the following data, find:
Upper quartile
25, 10, 40, 88, 45, 60, 77, 36, 18, 95, 56, 65, 7, 0, 38 and 83
From the following data, find:
Inter-quartile range
25, 10, 40, 88, 45, 60, 77, 36, 18, 95, 56, 65, 7, 0, 38 and 83
The ages of 37 students in a class are given in the following table:
| Age (in years) | 11 | 12 | 13 | 14 | 15 | 16 |
| Frequency | 2 | 4 | 6 | 10 | 8 | 7 |
Find the median wages for the following frequency distribution:
| Wages per day (in Rs) | 61 – 70 | 71 – 80 | 81 – 90 | 91 – 100 | 101 – 110 | 111 – 120 |
| No. of women workers | 5 | 15 | 20 | 30 | 20 | 8 |
Grouped frequency distribution of supply of milk to hotels and the number of hotels is given in the following table. Find the mode of the supply of milk.
| Milk (Litre) | 1 - 3 | 3 - 5 | 5 - 7 | 7 - 9 | 9 - 11 | 11 - 13 |
| No. of hotels | 7 | 5 | 15 | 20 | 35 | 18 |
The median of the following data is 50. Find the values of p and q, if the sum of all the frequencies is 90.
| Marks: | 20 -30 | 30-40 | 40-50 | 50-60 | 60-70 | 70-80 | 80-90 |
| Frequency: | P | 15 | 25 | 20 | q | 8 | 10 |
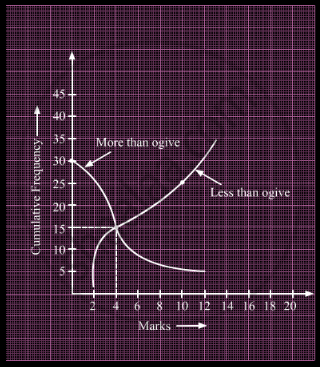
What is the value of the median of the data using the graph in the following figure of less than ogive and more than ogive?
If the difference of Mode and Median of a data is 24, then the difference of median and mean is ______.
In the following table, Σf = 200 and mean = 73. Find the missing frequencies f1, and f2.
| x | 0 | 50 | 100 | 150 | 200 | 250 |
| f | 46 | f1 | f2 | 25 | 10 | 5 |
Find the median of:
66, 98, 54, 92, 87, 63, 72.
The abscissa of the point of intersection of the less than type and of the more than type cumulative frequency curves of a grouped data gives its ______.
The median of an ungrouped data and the median calculated when the same data is grouped are always the same. Do you think that this is a correct statement? Give reason.
Weekly income of 600 families is tabulated below:
| Weekly income (in Rs) |
Number of families |
| 0 – 1000 | 250 |
| 1000 – 2000 | 190 |
| 2000 – 3000 | 100 |
| 3000 – 4000 | 40 |
| 4000 – 5000 | 15 |
| 5000 – 6000 | 5 |
| Total | 600 |
Compute the median income.
Find the values of a and b, if the sum of all the frequencies is 120 and the median of the following data is 55.
| Marks | 30 – 40 | 40 – 50 | 50 –60 | 60 – 70 | 70 –80 | 80 – 90 |
| Frequency | a | 40 | 27 | b | 15 | 24 |
If in a frequency distribution, the mean and median are 21 and 22 respectively, then its mode is approximately ______.
