Advertisements
Advertisements
Question
For a certain frequency distribution, the value of mean is 20 and mode is 11. Find the value of median.
Solution
The inter-relation between the measures of central tendency is given by
Mean – Mode = 3(Mean-Median)
20 – 11 = 3 (20-Median)
9 = 3 (20-Median)
9/3= 20-Median
3=20 -Median
median =20-3
Median = 17
RELATED QUESTIONS
The median of the following observations
11, 12, 14, (x - 2), (x + 4), (x + 9), 32, 38, 47 arranged in ascending order is 24.
Find the value of x and hence find the mean.
An incomplete distribution is given below:
| Variable: | 10-20 | 20-30 | 30-40 | 40-50 | 50-60 | 60-70 | 70-80 |
| Frequency: | 12 | 30 | - | 65 | - | 25 | 18 |
You are given that the median value is 46 and the total number of items is 230.
(i) Using the median formula fill up missing frequencies.
(ii) Calculate the AM of the completed distribution.
In a hospital, the ages of diabetic patients were recorded as follows. Find the median age.
| Age (in years) |
0 – 15 | 15 – 30 | 30 – 45 | 45 – 60 | 60 - 75 |
| No. of patients | 5 | 20 | 40 | 50 | 25 |
Compute mean from the following data:
| Marks | 0 – 7 | 7 – 14 | 14 – 21 | 21 – 28 | 28 – 35 | 35 – 42 | 42 – 49 |
| Number of Students | 3 | 4 | 7 | 11 | 0 | 16 | 9 |
If the median of the following frequency distribution is 32.5, find the values of `f_1 and f_2`.
| Class | 0 – 10 | 10 – 20 | 20 – 30 | 30 -40 | 40 – 50 | 50 – 60 | 60 – 70 | Total |
| Frequency | `f_1` |
5 |
9 | 12 | `f_2` | 3 | 2 | 40 |
Find the median wages for the following frequency distribution:
| Wages per day (in Rs) | 61 – 70 | 71 – 80 | 81 – 90 | 91 – 100 | 101 – 110 | 111 – 120 |
| No. of women workers | 5 | 15 | 20 | 30 | 20 | 8 |
The following table shows the number of patients of different age groups admitted to a hospital for treatment on a day. Find the median of ages of the patients.
| Age- group (Yrs.) | 10-20 | 20-30 | 30-40 | 40-50 | 50-60 | 60-70 |
| No. of patients | 40 | 32 | 35 | 45 | 33 | 15 |
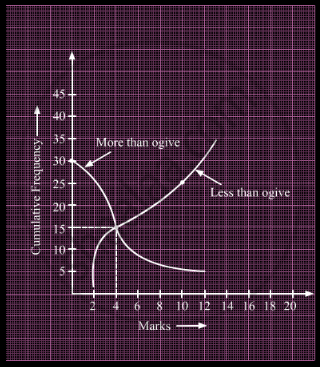
What is the value of the median of the data using the graph in the following figure of less than ogive and more than ogive?

If the mean of the following distribution is 3, find the value of p.
| x | 1 | 2 | 3 | 5 | p + 4 |
| f | 9 | 6 | 9 | 3 | 6 |
The prices of different articles and demand for them is shown in the following frequency distribution table. Find the median of the prices.
|
Price (Rupees)
|
20 less than | 20 – 40 | 40 – 60 | 60 – 80 | 80 – 100 |
| No. of articles | 140 | 100 | 80 | 60 | 20 |
Find the median of the following frequency distribution:
| x | 10 | 11 | 12 | 13 | 14 | 15 |
| f | 1 | 4 | 7 | 5 | 9 | 3 |
Calculate the median of the following distribution:
| Weight (in nearest kg.) | No. of students |
| 46 | 7 |
| 48 | 5 |
| 50 | 8 |
| 52 | 12 |
| 53 | 10 |
| 54 | 2 |
| 55 | 1 |
The median of the following observations 11, 12, 14, (x – 2), (x + 4), (x + 9), 32, 38, 47 arranged in ascending order is 24. Find the value of x and hence find the mean.
Mode and mean of a data are 12k and 15A. Median of the data is ______.
Consider the data:
| Class | 65 – 85 | 85 – 105 | 105 – 125 | 125 – 145 | 145 – 165 | 165 – 185 | 185 – 205 |
| Frequency | 4 | 5 | 13 | 20 | 14 | 7 | 4 |
The difference of the upper limit of the median class and the lower limit of the modal class is:
Will the median class and modal class of grouped data always be different? Justify your answer.
Find the modal and median classes of the following distribution.
| Class | 0 – 20 | 20 – 40 | 40 – 60 | 60 – 80 | 80 – 100 |
| Frequency | 11 | 22 | 19 | 18 | 7 |
The following table gives the monthly consumption of electricity of 100 families:
| Monthly Consumption (in units) |
130 – 140 | 140 – 150 | 150 – 160 | 160 – 170 | 170 – 180 | 180 – 190 | 190 – 200 |
| Number of families |
5 | 9 | 17 | 28 | 24 | 10 | 7 |
Find the median of the above data.
