Advertisements
Advertisements
प्रश्न
Bar diagram of first term scores of a student are given.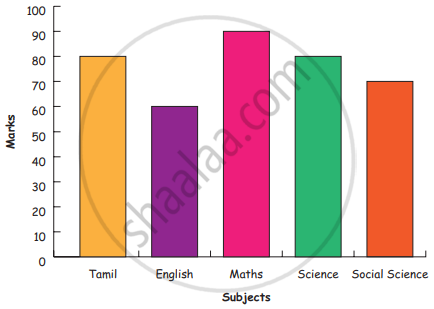
a. The highest score is in _________.
b. The lowest score is in _________.
c. The same scores are in _________ and _________.
उत्तर
a. The highest score is in Maths.
b. The lowest score is in English.
c. The same scores are in Tamil and Science.
APPEARS IN
संबंधित प्रश्न
Practice time: Afterschool
Ask 10 of your friends about what they like to do most after school.
| What they like to do after school |
Number of children |
| Watching TV | |
| Playing football | |
| Reading storybooks | |
Comparison of parts of a whole may be done by a ______.
To represent the population of different towns using bar graph, it is convenient to take one unit length to represent one person.
The bar graph given below represents approximate length (in kilometres) of some National Highways in India. Study the bar graph and answer the following questions:
Scale: 1 unit length = 200 km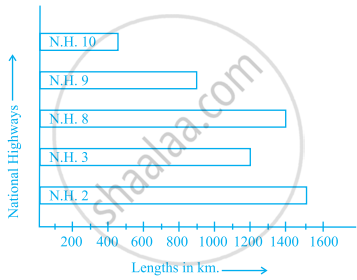
(a) Which National Highway (N.H.) is the longest among the above?
(b) Which National Highway is the shortest among the above?
(c) What is the length of National Highway 9?
(d) Length of which National Highway is about three times the National Highway10?
Number of mobile phone users in various age groups in a city is listed below:
| Age group (in years) | Number of mobile users |
| 1 – 20 | 25000 |
| 21 – 40 | 40000 |
| 41 – 50 | 35000 |
| 61 – 80 | 10000 |
Draw a bar graph to represent the above information.
| Crop | Area of land (in million hectares) |
| Rice | 50 |
| Wheat | 30 |
| Pulses | 20 |
| Sugarcane | 25 |
| Cotton | 15 |
Prepare a bar graph of the data.
The bar graph given below represents the circulation of newspapers (dailies) in a town in six languages (the figures are approximated to hundreds).

Study the bar graph and answer the following questions:
- Find the total number of newspapers read in Hindi, Punjabi, Urdu, Marathi and Tamil.
- Find the excess number of newspapers read in Hindi than those in English.
- Name the language in which the least number of newspapers are read.
- Write the total circulation of newspapers in the town.
Study the double bar graph shown below and answer the questions that follow:
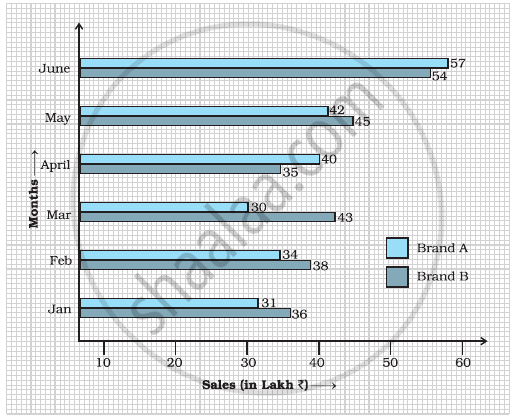
- What information is represented by the above double bar graph?
- In which month sales of Brand A decreased as compared to the previous month?
- What is the difference in sales of both the Brands for the month of June?
- Find the average sales of Brand B for the six months.
- List all months for which the sales of Brand B was less than that of Brand A.
- Find the ratio of sales of Brand A as compared to Brand B for the month of January.
Below is a list of 10 tallest buildings in India.
This list ranks buildings in India that stand at least 150 m (492 ft.) tall, based on standard height measurement. This includes spires and architectural details but does not include antenna marks. Following data is given as per the available information till 2009. Since new buildings are always under construction, go on-line to check new taller buildings.
Use the information given in the table about sky scrapers to answer the following questions:
| Name | City | Height | Floors | Year |
| Planet | Mumbai | 181 m | 51 | 2009 |
| UB Tower | Bengaluru | 184 m | 20 | 2006 |
| Ashok Towers | Mumbai | 193 m | 49 | 2009 |
| The Imperial I | Mumbai | 249 m | 60 | 2009 |
| The Imperial II | Mumbai | 249 m | 60 | 2009 |
| RNA Mirage | Mumbai | 180 m | 40 | 2009 |
| Oberoi Woods Tower I | Mumbai | 170 m | 40 | 2009 |
| Oberoi Woods Tower II | Mumbai | 170 m | 40 | 2009 |
| Oberoi Woods Tower III | Mumbai | 170 m | 40 | 2009 |
| MVRDC | Mumbai | 156 m | 35 | 2002 |
(a) Find the height of each storey of the three tallest buildings and write them in the following table:
| Building | Height | Number of storeys | Height of each storey |
(b) The average height of one storey for the buildings given in (a) is ______.
(c) Which city in this list has the largest percentage of skyscrapers? What is the percentage?
(d) What is the range of data?
(e) Find the median of the data.
(f) Draw a bar graph for given data.
The data given below shows the production of motorbikes in a factory for some months of two consecutive years.
| Months | Feb | May | August | October | December |
| 2008 | 2700 | 3200 | 6000 | 5000 | 4200 |
| 2007 | 2800 | 4500 | 4800 | 4800 | 5200 |
Study the table given above and answer the following questions:
- Draw a double bar graph using appropriate scale to depict the above information and compare them.
- In which year was the total output the maximum?
- Find the mean production for the year 2007.
- For which month was the difference between the production for the two years the maximum?
- In which month for the year 2008, the production was the maximum?
- In which month for the year 2007, the production was the least?
