Advertisements
Advertisements
प्रश्न
Diagram is given below shows velocity – time graph of car P and Q, starting from the same place and in the same direction. Calculate the Acceleration of car Q between 2 s – 5 s.

उत्तर

Acceleration of car Q between 2 s − 5 s = +Slope of v-t graph (CD) for car Q
= `"DE"/"CE"=25/(5-2)=25/3` = 8.33 ms−2
APPEARS IN
संबंधित प्रश्न
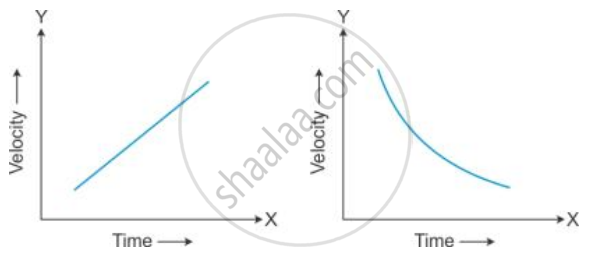
State the type of motion represented by the following sketches in Figures.
Give an example of each type of motion.
When is the acceleration due to gravity negative?
Draw velocity – time graph for the following situation:
When a body is moving with variable velocity and variable acceleration.
A racing car, initially at rest, picks up a velocity of 180 kmh−1 in 4.5 s. Calculate
- acceleration
- distance covered by the car.
Can you use the relation [B1]?
The speed of a car increases from 10 km/h to 64 km/h in 10 seconds. What will be its acceleration?
The distance covered by a body is directly proportional to the square of the time elapsed. What can you say about its acceleration?
From the given v-t graph it can be inferred that an object is

The acceleration of the body that moves with a uniform velocity will be ______.
The value of acceleration for a body at rest is ______.
