Advertisements
Advertisements
Question
Diagram is given below shows velocity – time graph of car P and Q, starting from the same place and in the same direction. Calculate the Acceleration of car Q between 2 s – 5 s.

Solution

Acceleration of car Q between 2 s − 5 s = +Slope of v-t graph (CD) for car Q
= `"DE"/"CE"=25/(5-2)=25/3` = 8.33 ms−2
APPEARS IN
RELATED QUESTIONS
A toy car initially moving with uniform velocity of 18 km h-1 comes to a stop in 2 s. Find the retardation of the car in S.I. units.
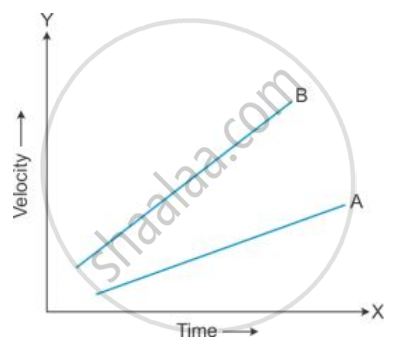
Figure shows the velocity-time graphs for two cars A and B moving in the same direction. Which car has greater acceleration? Give reasons to your answer.

A cyclist driving at 5 ms−1, picks a velocity of 10 ms−1, over a distance of 50 m. Calculate
- acceleration
- time in which the cyclist picks up above velocity.
An aeroplane lands at 216 kmh−1 and stops after covering a runway of 2 m. Calculate the acceleration and the time, in which it comes to rest.
A truck running at 90 kmh−1, is brought to rest over a distance of 25 m. Calculate the retardation and time for which brakes are applied.
Convert the following acceleration:
7200 km/h2 into m/s2
A car accelerates to a velocity of 30 m/s in 10 s and then decelerates for 20 s so that it stops. Draw a velocity-time graph to represent the motion and find:
Distance travelled
When a body starts from rest, the acceleration of the body after 2 seconds in ______ of its displacement.
The acceleration of the body that moves with a uniform velocity will be ______.
When an object undergoes acceleration ______.
