Advertisements
Advertisements
प्रश्न
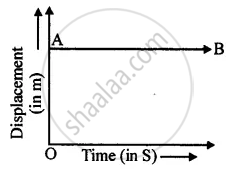
Draw displacement – time graph for the following situation:
When a body is stationary.
उत्तर
Displacement – time graph when a body is stationary.

APPEARS IN
संबंधित प्रश्न
Diagram is given below shows velocity – time graph of car P and Q, starting from the same place and in the same direction. Calculate which car is ahead after 10 s and by how much?

The graph of one quantity versus another result in a straight line. How are the quantities related to each other?
Draw the following graph:
Speed versus time for a uniformly retarded motion.
Given below are the speed -time graphs. Match them with their corresponding motions :
 |
(a) Uniformity retared motion |
 |
(b) Non-uniformity acceleration |
 |
(c) Non-uniform motion |
 |
(d) uniform motion |
Its time-displacement graph is a straight line.
Draw velocity-time graph to show:
Zero acceleration
Write a sentence to explain the shape of graph.
Derive the equation
S = ut+ `1/2` at2
Using a speed- time graph
The slope of the speed–time graph gives ______.
Which of the following can determine the acceleration of a moving object.
Slope of the velocity-time graph gives ______.
