Advertisements
Advertisements
प्रश्न
Draw the graph for the following
y = 2x
उत्तर
When x = −2, y = 2(−2) = −4
When x = 0, y = 2(0) = 0
When x = 2, y = 2(2) = 4
When x = 3, y = 2(3) = 6
| x | −2 | 0 | 2 | 3 |
| y | −4 | 0 | 4 | 6 |
Plot the points (−2, −4) (0, 0) (2, 4) and (3, 6) in the graph sheet we get a straight line.
APPEARS IN
संबंधित प्रश्न
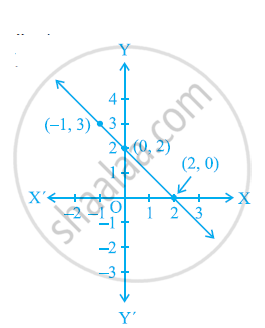
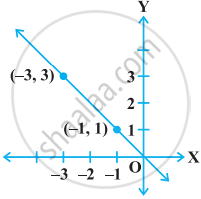
From the choices given below, choose the equation whose graphs are given in the given figures.
For the first figure
(i) y = x
(ii) x + y = 0
(iii) y = 2x
(iv) 2 + 3y = 7x

For the second figure
(i) y = x +2
(ii) y = x − 2
(iii) y = − x + 2
(iv) x + 2y = 6
Draw the graph of the following linear equation in two variable : ` x / 2 - y/ 3 = 2`
Draw the graph of the equation given below. Also, find the coordinates of the point
where the graph cuts the coordinate axes : 2x + y = 6
Draw the graph (straight line) given by equation x - 3y = 18. If the straight line is drawn passes through the points (m, - 5) and (6, n); find the values of m and n.
Draw the graph for the following
y = `(3/2)x + 3`
A pair of linear equations has no solution then the graphical representation is
Draw the graph of y = x – 4
The graph given below represents the linear equation x + y = 0.
Every point on the graph of a linear equation in two variables does not represent a solution of the linear equation.
Show that the points A(1, 2), B(– 1, – 16) and C(0, – 7) lie on the graph of the linear equation y = 9x – 7.
