Advertisements
Advertisements
प्रश्न
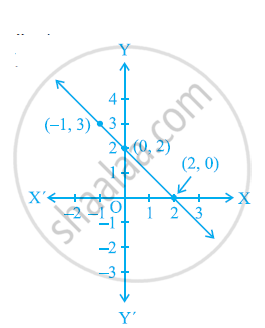
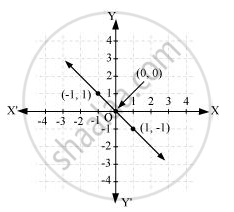
From the choices given below, choose the equation whose graphs are given in the given figures.
For the first figure
(i) y = x
(ii) x + y = 0
(iii) y = 2x
(iv) 2 + 3y = 7x

For the second figure
(i) y = x +2
(ii) y = x − 2
(iii) y = − x + 2
(iv) x + 2y = 6

उत्तर

Points on the given line are (−1, 1), (0, 0), and (1, −1).
It can be observed that the coordinates of the points of the graph satisfy the equation x + y = 0. Therefore, x + y = 0 is the equation corresponding to the graph as shown in the first figure.
Hence, (ii) is the correct answer.

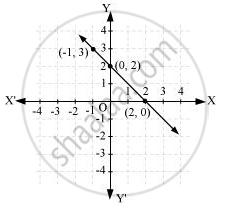
Points on the given line are (−1, 3), (0, 2), and (2, 0). It can be observed that the coordinates of the points of the graph satisfy the equation y = − x + 2.
Therefore, y = − x + 2 is the equation corresponding to the graph shown in the second figure.
Hence, (iii) is the correct answer.
APPEARS IN
संबंधित प्रश्न
Draw the graph of the following linear equation in two variable : y = 2x
Draw the graph of the following linear equation in two variable : 3x + 5y = 15
Draw the graph of the following linear equations in two variable : 2𝑦 = −𝑥 + 1
Plot the points (3, 5) and (− 1, 3) on a graph paper and verify that the straight line passing
through these points also passes through the point (1, 4).
Solve, graphically, the following pairs of equation :
3x + 7y = 27
8 - y = `(5)/(2)x`
A straight line passes through the points (2, 5) and (-4, -7). Plot these points on a graph paper and draw the straight line passes through these points. If points (a, -1) and (-5, b) lie on the line drawn, find the value of a and b.
Draw the graph for the following
y = 4x – 1
A pair of linear equations has no solution then the graphical representation is
The graph given below represents the linear equation x = 3 (see figure).

Draw the graph of the linear equation whose solutions are represented by the points having the sum of the coordinates as 10 units.
