Advertisements
Advertisements
Question
From the choices given below, choose the equation whose graphs are given in the given figures.
For the first figure
(i) y = x
(ii) x + y = 0
(iii) y = 2x
(iv) 2 + 3y = 7x

For the second figure
(i) y = x +2
(ii) y = x − 2
(iii) y = − x + 2
(iv) x + 2y = 6
Solution
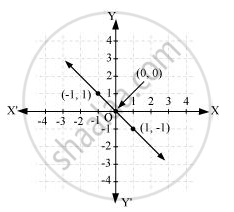
Points on the given line are (−1, 1), (0, 0), and (1, −1).
It can be observed that the coordinates of the points of the graph satisfy the equation x + y = 0. Therefore, x + y = 0 is the equation corresponding to the graph as shown in the first figure.
Hence, (ii) is the correct answer.
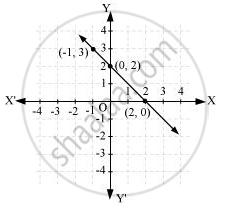
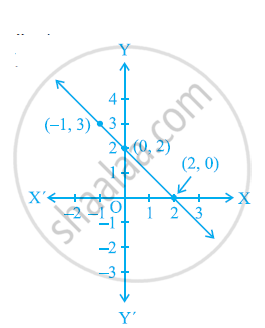
Points on the given line are (−1, 3), (0, 2), and (2, 0). It can be observed that the coordinates of the points of the graph satisfy the equation y = − x + 2.
Therefore, y = − x + 2 is the equation corresponding to the graph shown in the second figure.
Hence, (iii) is the correct answer.
APPEARS IN
RELATED QUESTIONS
If the work done by a body on application of a constant force is directly proportional to the distance travelled by the body, express this in the form of an equation in two variables and draw the graph of the same by taking the constant force as 5 units. Also read from the graph the work done when the distance travelled by the body is
(i) 2 units (ii) 0 unit
Yamini and Fatima, two students of Class IX of a school, together contributed Rs. 100 towards the Prime Minister’s Relief Fund to help the earthquake victims. Write a linear equation which satisfies this data. (You may take their contributions as Rs. x and Rs. y.) Draw the graph of the same.
Draw the graph of the equation 2x + y = 6. Shade the region bounded by the graph and the
coordinate axes. Also, find the area of the shaded region.
Draw the graph of y = | x |.
Use graph paper for this question. Draw the graph of 2x - y - 1 = 0 and 2x + y = 9 on the same axes. Use 2 cm = 1 unit on both axes and plot only 3 points per line. Write down the coordinates of the point of intersection of the two lines.
Draw the graph of the equation
y = 5x - 4 Find graphically
a. the value of x, when y = 1
b. the value of y, when x = -2
Draw the graph of y = – 3x
Draw the graph of y = x – 4
The graph of the linear equation 2x + 3y = 6 cuts the y-axis at the point ______.
Draw the graph of the linear equation whose solutions are represented by the points having the sum of the coordinates as 10 units.
