Topics
Number Systems
Number Systems
Polynomials
Algebra
Coordinate Geometry
Linear Equations in Two Variables
Geometry
Coordinate Geometry
Introduction to Euclid’S Geometry
Mensuration
Statistics and Probability
Lines and Angles
- Introduction to Lines and Angles
- Basic Terms and Definitions
- Intersecting Lines and Non-intersecting Lines
- Introduction to Parallel Lines
- Pairs of Angles
- Parallel Lines and a Transversal
- Angle Sum Property of a Triangle
Triangles
- Concept of Triangles
- Congruence of Triangles
- Criteria for Congruence of Triangles
- Properties of a Triangle
- Some More Criteria for Congruence of Triangles
- Inequalities in a Triangle
Quadrilaterals
- Concept of Quadrilaterals
- Properties of a Quadrilateral
- Types of Quadrilaterals
- Another Condition for a Quadrilateral to Be a Parallelogram
- Theorem of Midpoints of Two Sides of a Triangle
- Property: The Opposite Sides of a Parallelogram Are of Equal Length.
- Theorem: A Diagonal of a Parallelogram Divides It into Two Congruent Triangles.
- Theorem : If Each Pair of Opposite Sides of a Quadrilateral is Equal, Then It is a Parallelogram.
- Property: The Opposite Angles of a Parallelogram Are of Equal Measure.
- Theorem: If in a Quadrilateral, Each Pair of Opposite Angles is Equal, Then It is a Parallelogram.
- Property: The diagonals of a parallelogram bisect each other. (at the point of their intersection)
- Theorem : If the Diagonals of a Quadrilateral Bisect Each Other, Then It is a Parallelogram
Circles
Areas - Heron’S Formula
Surface Areas and Volumes
Statistics
Algebraic Expressions
Algebraic Identities
Area
Constructions
- Introduction of Constructions
- Basic Constructions
- Some Constructions of Triangles
Probability
Notes
The solutions of a linear equation in two variables algebraically.
Example : x +2y = 6 ...(1)
can be expressed in the form of a table as follows by writing the values of y below the corresponding values of x :
| X | 0 | 2 | 4 | 6 | ... |
| Y | 3 | 2 | 1 | 0 | ... |
Let us plot the points (0, 3), (2, 2), (4, 1) and (6, 0) on a graph paper. Now join any two of these points and obtain a line. Let us call this as line AB in following fig.
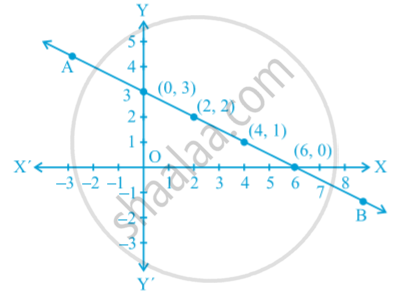
Now, pick another point on this line, say (8, –1). Pick any other point on this line AB and verify whether its coordinates satisfy the equation or not.
1. Every point whose coordinates satisfy Equation (1) lies on the line AB.
2. Every point (a, b) on the line AB gives a solution x = a, y = b of Equation (1).
3. Any point, which does not lie on the line AB, is not a solution of Equation (1).
The every point on the line satisfies the equation of the line and every solution of the equation is a point on the line. In fact, a linear equation in two variables is represented geometrically by a line whose points make up the collection of solutions of the equation. This is called the graph of the linear equation. So, to obtain the graph of a linear equation in two variables, it is enough to plot two points corresponding to two solutions and join them by a line.
Remark : The reason that a, degree one, polynomial equation ax + by + c = 0 is called a linear equation is that its geometrical representation is a straight line.
Shaalaa.com | Graphs of linear equations in two variables.
Related QuestionsVIEW ALL [103]
Find the values.
y = x + 3
| x | 0 | − 2 | ||
| y | 0 | − 3 |
