Advertisements
Advertisements
Question
Draw the graph of the linear equation whose solutions are represented by the points having the sum of the coordinates as 10 units.
Solution
As per question, the sum of the coordinates is 10 units.
Let x and y be two coordinates, then we get x + y = 10.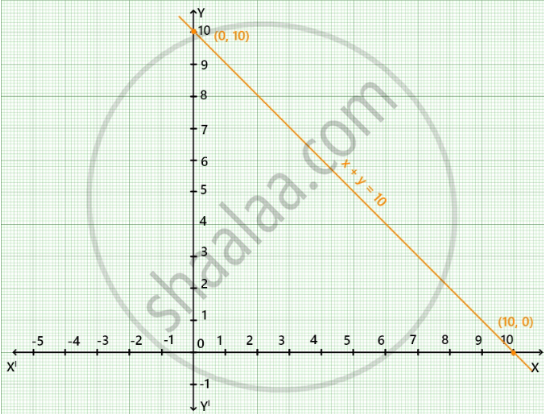
For x = 5, y = 5, therefore, (5, 5) lies on the graph of x + y = 10.
For x = 3, y = 7, therefore, (3, 7) lies on the graph of x + y = 10.
Now, plotting the points (5, 5) and (3, 7) on the graph paper and joining them by a line, we get graph of the linear equation x + y = 10.
APPEARS IN
RELATED QUESTIONS
Yamini and Fatima, two students of Class IX of a school, together contributed Rs. 100 towards the Prime Minister’s Relief Fund to help the earthquake victims. Write a linear equation which satisfies this data. (You may take their contributions as Rs. x and Rs. y.) Draw the graph of the same.
Draw the graph for the equation, given below :
y + 7 = 0
Draw the graph of the equation
4x + 3y + 6 = 0
From the graph, find :
(i) y1, the value of y, when x = 12.
(ii) y2, the value of y, when x = - 6.
Use the graphical method to find the value of k, if:
(k, -3) lies on the straight line 2x + 3y = 1
Draw the graph of the equation 4x - 3y + 12 = 0.
Also, find the area of the triangle formed by the line drawn and the coordinate axes.
Draw the graph of the equation
y = 5x - 4 Find graphically
a. the value of x, when y = 1
b. the value of y, when x = -2
Use the given table and draw the graph of a straight line.
| X | 1 | 2 | 3 | P |
| Y | 1 | q | -5 | 7 |
Find graphically the values of 'p' and 'q'.
Draw the graph of the following equation:
x = – 7
Draw the graph of y = – 3x
Draw the graph of y = 2x + 5
