Advertisements
Advertisements
Question
Use the given table and draw the graph of a straight line.
| X | 1 | 2 | 3 | P |
| Y | 1 | q | -5 | 7 |
Find graphically the values of 'p' and 'q'.
Solution
The graph is as follows: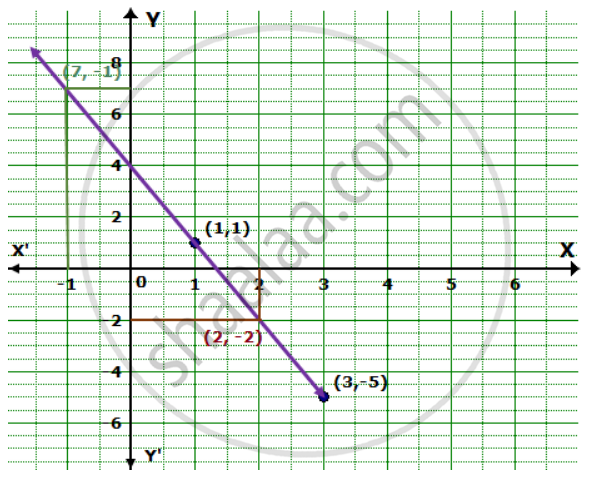
From the graph, we find that p = -1 and q = -2.
APPEARS IN
RELATED QUESTIONS
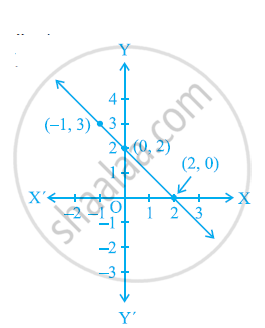
From the choices given below, choose the equation whose graphs are given in the given figures.
For the first figure
(i) y = x
(ii) x + y = 0
(iii) y = 2x
(iv) 2 + 3y = 7x

For the second figure
(i) y = x +2
(ii) y = x − 2
(iii) y = − x + 2
(iv) x + 2y = 6
Draw the graph of the following linear equation in two variable : –x + y = 6
Draw the graph of the equation given below. Also, find the coordinate of the points
where the graph cuts the coordinate axes : 3x + 2y + 6 = 0
Draw the graph for the equation, given below :
x + 5 = 0
Draw the graph for the equation, given below :
y + 7 = 0
Use graph paper for this question. Draw the graph of 2x - y - 1 = 0 and 2x + y = 9 on the same axes. Use 2 cm = 1 unit on both axes and plot only 3 points per line. Write down the coordinates of the point of intersection of the two lines.
Draw the graph of the equation 4x - 3y + 12 = 0.
Also, find the area of the triangle formed by the line drawn and the coordinate axes.
A straight line passes through the points (2, 5) and (-4, -7). Plot these points on a graph paper and draw the straight line passes through these points. If points (a, -1) and (-5, b) lie on the line drawn, find the value of a and b.
A pair of linear equations has no solution then the graphical representation is
Draw the graph of y = 2x + 5
