Advertisements
Advertisements
Question
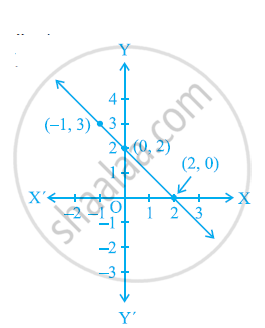
The graph of the linear equation 2x + 3y = 6 cuts the y-axis at the point ______.
Options
(2, 0)
(0, 3)
(3, 0)
(0, 2)
Solution
The graph of the linear equation 2x + 3y = 6 cuts the y-axis at the point (0, 2).
Explanation:
Since, the graph of linear equation 2x + 3y = 6 cuts the y-axis.
So, we put x = 0 in the given equation 2x + 3y = 6, we get
2 × 0 + 3y = 6
⇒ 3y = 6
y = 2
Hence, at the point (0, 2), the given linear equation cuts the y-axis.
APPEARS IN
RELATED QUESTIONS
Draw the graph of the following linear equations in two variables:
x – y = 2
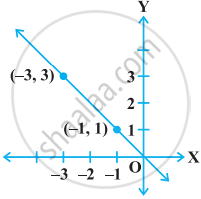
From the choices given below, choose the equation whose graphs are given in the given figures.
For the first figure
(i) y = x
(ii) x + y = 0
(iii) y = 2x
(iv) 2 + 3y = 7x

For the second figure
(i) y = x +2
(ii) y = x − 2
(iii) y = − x + 2
(iv) x + 2y = 6
Yamini and Fatima, two students of Class IX of a school, together contributed Rs. 100 towards the Prime Minister’s Relief Fund to help the earthquake victims. Write a linear equation which satisfies this data. (You may take their contributions as Rs. x and Rs. y.) Draw the graph of the same.
Using a scale of 1 cm to 1 unit for both the axes, draw the graphs of the following equations: 6y = 5x + 10, y = 5x - 15.
From the graph find :
(i) the coordinates of the point where the two lines intersect;
(ii) the area of the triangle between the lines and the x-axis.
The graph of y = 6 is a line ______.
The graph of the linear equation y = x passes through the point ______.
The graph given below represents the linear equation x + y = 0.
The graph given below represents the linear equation x = 3 (see figure).

The following observed values of x and y are thought to satisfy a linear equation. Write the linear equation:
| x | 6 | – 6 |
| y | –2 | 6 |
Draw the graph using the values of x, y as given in the above table. At what points the graph of the linear equation
- cuts the x-axis
- cuts the y-axis
Draw the graph of the linear equation 3x + 4y = 6. At what points, the graph cuts the x-axis and the y-axis.
