Advertisements
Advertisements
Question
Draw the graph of the following linear equations in two variables:
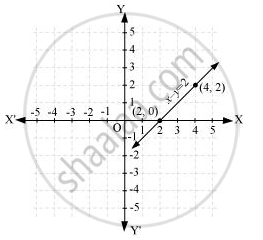
x – y = 2
Solution
It can be observed that x = 4, y = 2 and x = 2, y = 0 are solutions of the above equation. Therefore, the solution table is as follows.
| x | 4 | 2 |
| y | 2 | 0 |
The graph of the above equation is constructed as follows.
APPEARS IN
RELATED QUESTIONS
Draw the graph of the following linear equation in two variable : y = 2x
Plot the points (3, 5) and (− 1, 3) on a graph paper and verify that the straight line passing
through these points also passes through the point (1, 4).
Draw the graph of the equation given below. Also, find the coordinate of the points
where the graph cuts the coordinate axes : 3x + 2y + 6 = 0
Draw the graph for the equation, given below :
5x + y + 5 = 0
Use the table given below to draw the graph.
| X | - 5 | - 1 | 3 | b | 13 |
| Y | - 2 | a | 2 | 5 | 7 |
From your graph, find the values of 'a' and 'b'.
State a linear relationship between the variables x and y.
By drawing a graph for each of the equations 3x + y + 5 = 0; 3y - x = 5 and 2x + 5y = 1 on the same graph paper; show that the lines given by these equations are concurrent (i.e. they pass through the same point). Take 2 cm = 1 unit on both the axes.
Using a scale of 1 cm to 1 unit for both the axes, draw the graphs of the following equations: 6y = 5x + 10, y = 5x - 15.
From the graph find :
(i) the coordinates of the point where the two lines intersect;
(ii) the area of the triangle between the lines and the x-axis.
Draw the graph for the following
y = 4x – 1
The graph of y = 6 is a line ______.
The graph given below represents the linear equation x = 3 (see figure).

