Advertisements
Advertisements
प्रश्न
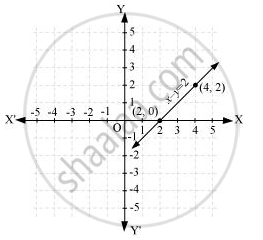
Draw the graph of the following linear equations in two variables:
x – y = 2
उत्तर
It can be observed that x = 4, y = 2 and x = 2, y = 0 are solutions of the above equation. Therefore, the solution table is as follows.
| x | 4 | 2 |
| y | 2 | 0 |
The graph of the above equation is constructed as follows.

APPEARS IN
संबंधित प्रश्न
Draw the graph of the equatio ` x / y + y /4 = 1` Also, find the area of the triangle formed by the
line and the co-ordinates axes.
Draw the graph for the equation, given below :
2x + 3y = 0
Draw the graph for the equation, given below :
3x + 2y = 6
Solve, graphically, the following pairs of equation :
3x + 7y = 27
8 - y = `(5)/(2)x`
Use graph paper for this question. Draw the graph of 2x - y - 1 = 0 and 2x + y = 9 on the same axes. Use 2 cm = 1 unit on both axes and plot only 3 points per line. Write down the coordinates of the point of intersection of the two lines.
Draw the graphs of the following linear equations:
3x + 2y - 6 = 0
Draw the graph of y = 2x + 5
Find the values.
y = x + 3
| x | 0 | − 2 | ||
| y | 0 | − 3 |
The point (0, 3) lies on the graph of the linear equation 3x + 4y = 12.
Determine the point on the graph of the linear equation 2x + 5y = 19, whose ordinate is `1 1/2` times its abscissa.
