Advertisements
Advertisements
प्रश्न
Find the values.
y = 3x + 1
| x | − 1 | 0 | 1 | 2 |
| y |
उत्तर
Let y = 3x + 1 = 0
(i) x = −1, y = 3(−1) + 1 = 0
∴ y = −2
(ii) x = 0, y = 3(0) + 1 = 0
∴ y = 1
(iii) x = 1, y = 3(1) + 1 = 0
∴ y = 4
(iv) x = 2, y = 3(2) + 1 = 0
∴ y = 7
y = 3x + 1
| x | −1 | 0 | 1 | 2 |
| y | −2 | 1 | 4 | 7 |
APPEARS IN
संबंधित प्रश्न
Draw the graph of the following linear equation in two variable : 3x + 5y = 15
From the choices given below, choose the equation whose graph is given in fig. below.
(i) y = x + 2 (ii) y = x – 2 (iii) y = −x + 2 (iv) x + 2y = 6
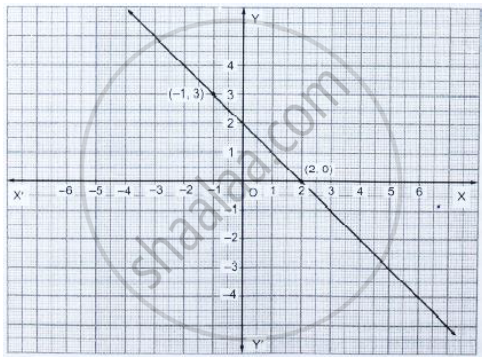
[Hint: Clearly, (2, 0) and (−1, 3) satisfy the equation y = −x + 2]
Draw the graph of y = | x |.
Draw the graph (straight line) given by equation x - 3y = 18. If the straight line is drawn passes through the points (m, - 5) and (6, n); find the values of m and n.
Draw the graphs of the following linear equations:
x = 3
Use the given table and draw the graph of a straight line.
| X | 1 | 2 | 3 | P |
| Y | 1 | q | -5 | 7 |
Find graphically the values of 'p' and 'q'.
Draw the graph for the following
y = `(3/2)x + 3`
Draw the graph of the following equation:
x = – 7
Draw the graph of y = 2x + 5
The following observed values of x and y are thought to satisfy a linear equation. Write the linear equation:
| x | 6 | – 6 |
| y | –2 | 6 |
Draw the graph using the values of x, y as given in the above table. At what points the graph of the linear equation
- cuts the x-axis
- cuts the y-axis
