Advertisements
Advertisements
प्रश्न
For a certain frequency distribution, the values of Assumed mean (A) = 1300, `sumf_id_i` = 900 and `sumfi` = 100. Find the value of mean (`barx`) .
उत्तर
We have
(A) = 1300, `sumf_id_i` = 900 and `sumfi` = 100=N.
`barx=A+1/Nsum_(i=1)^nf_id_i`
`barx=1300+1/100 xx900`
`barx=1300+9`
`barx=1309`
APPEARS IN
संबंधित प्रश्न
Compute mean from the following data:
| Marks | 0 – 7 | 7 – 14 | 14 – 21 | 21 – 28 | 28 – 35 | 35 – 42 | 42 – 49 |
| Number of Students | 3 | 4 | 7 | 11 | 0 | 16 | 9 |
The following table shows the daily wages of workers in a factory:
| Daily wages in (Rs) | 0 – 100 | 100 – 200 | 200 – 300 | 300 – 400 | 400 – 500 |
| Number of workers | 40 | 32 | 48 | 22 | 8 |
Find the median daily wage income of the workers.
Find the median wages for the following frequency distribution:
| Wages per day (in Rs) | 61 – 70 | 71 – 80 | 81 – 90 | 91 – 100 | 101 – 110 | 111 – 120 |
| No. of women workers | 5 | 15 | 20 | 30 | 20 | 8 |
Find the median from the following data:
| Marks | No of students |
| Below 10 | 12 |
| Below 20 | 32 |
| Below 30 | 57 |
| Below 40 | 80 |
| Below 50 | 92 |
| Below 60 | 116 |
| Below 70 | 164 |
| Below 80 | 200 |
Grouped frequency distribution of supply of milk to hotels and the number of hotels is given in the following table. Find the mode of the supply of milk.
| Milk (Litre) | 1 - 3 | 3 - 5 | 5 - 7 | 7 - 9 | 9 - 11 | 11 - 13 |
| No. of hotels | 7 | 5 | 15 | 20 | 35 | 18 |
Find the correct answer from the alternatives given.
| Distance Covered per litre (km) | 12 - 14 | 14 - 16 | 16 - 18 | 18 - 20 |
| No. of cars | 11 | 12 | 20 | 7 |
The median of the distances covered per litre shown in the above data is in the group . . . . . .
The following frequency distribution table shows the number of mango trees in a grove and their yield of mangoes, and also the cumulative frequencies. Find the median of the data.
| Class (No. of mangoes) |
Frequency (No. of trees) |
Cumulative frequency (less than) |
| 50-100 | 33 | 33 |
| 100-150 | 30 | 63 |
| 150-200 | 90 | 153 |
| 200-250 | 80 | 233 |
| 250-300 | 17 | 250 |
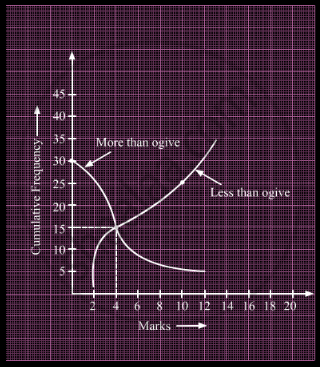
What is the value of the median of the data using the graph in the following figure of less than ogive and more than ogive?

In the graphical representation of a frequency distribution, if the distance between mode and mean is ktimes the distance between median and mean, then write the value of k.
Find the median of:
66, 98, 54, 92, 87, 63, 72.
The prices of different articles and demand for them is shown in the following frequency distribution table. Find the median of the prices.
|
Price (Rupees)
|
20 less than | 20 – 40 | 40 – 60 | 60 – 80 | 80 – 100 |
| No. of articles | 140 | 100 | 80 | 60 | 20 |
Find the median of the following frequency distribution:
| x | 10 | 11 | 12 | 13 | 14 | 15 |
| f | 1 | 4 | 7 | 5 | 9 | 3 |
The median of the following observations 11, 12, 14, (x – 2), (x + 4), (x + 9), 32, 38, 47 arranged in ascending order is 24. Find the value of x and hence find the mean.
The Median when it is given that mode and mean are 8 and 9 respectively, is ______.
Consider the following frequency distribution:
| Class | 0 – 5 | 6 – 11 | 12 – 17 | 18 – 23 | 24 – 29 |
| Frequency | 13 | 10 | 15 | 8 | 11 |
The upper limit of the median class is:
The median of an ungrouped data and the median calculated when the same data is grouped are always the same. Do you think that this is a correct statement? Give reason.
Weekly income of 600 families is tabulated below:
| Weekly income (in Rs) |
Number of families |
| 0 – 1000 | 250 |
| 1000 – 2000 | 190 |
| 2000 – 3000 | 100 |
| 3000 – 4000 | 40 |
| 4000 – 5000 | 15 |
| 5000 – 6000 | 5 |
| Total | 600 |
Compute the median income.
If in a frequency distribution, the mean and median are 21 and 22 respectively, then its mode is approximately ______.
