Advertisements
Advertisements
प्रश्न
India’s population as per 2011 census is:
पर्याय
1028 million
3287 million
3182 million
1210 million
उत्तर
1210 million
APPEARS IN
संबंधित प्रश्न
With the help of suitable diagram describe the logistic population growth curve.
What is ‘carrying capacity’ of a species in a habitat ? Why is logistic growth model considered more realistic?
Examine the following statement and correct the incorrect one.
Greater economic prosperity indicates the development of a region.
Answer the following question.
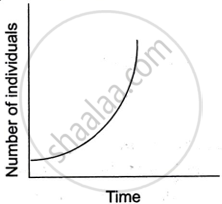
Compare, giving reasons, the J-shaped and S-shaped models of population growth of a species.
Identify the correct correlation :
A: Assertion; R: Reasoning
A: Population of a region does not change.
R: Birth rate, death rate, and migration affect the population of a region.
Identify the correct correlation :
A: Assertion; R: Reasoning
A: In stage 2, the death rate reduces but the birth rate is constant.
R: The population increases rapidly in stage 2.
Give a geographical reason:
Population may increase though birth rates are low.
Assertion: Population of a region does not change.
Reason: Birth rate, death rate and migration affect the population of a region.
Differentiate between
Crude Birth Rate and Crude Death Rate
Which one of the following is not a push factor?
Birth rate and death rate.
What is the impact of migration?
What is the impact of migration?
What are the components of population change?
Distinguish between the place of origin and the place of destination.
What is the average sex ratio In India (2011)?
The continent that has the highest growth rate of population.
What is the present annual growth rate of India?
The country having lowest growth rate of population.
Which one of the following is not a component of population change?
How many times the world population has increased during the last 500 years?
What is the present growth rate of population in the world?
Which of the following is not a push factor for migration?
Which are the components of population change?
Which is the most populated country?

Which is not in stage III?
Study the given graph carefully and answer the following question:
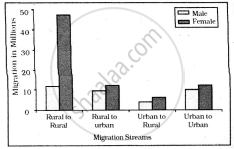
Intra-state Migration by place of Last Residence Indicating Migration Streams India, 2011
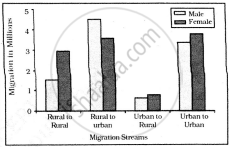
Inter-state Migration by Place of Last Residence Indicating Migration Streams India, 2011
Who dominates the intra-state migration of short distances?
The number of mice in a laboratory was 100 on a particular day. After one year their number increased to 120. Calculate the growth rate in the population.
Ratio between mortality and neutrality is called ______.
In an exponential bacterial culture, the number of cells/ml is plotted o half log group. The growth is ______.
Crude Death Rate (CDR):-
Which of the following statement is true?
(i) CBR = Bi/P × 1000
(ii) COR = D /P × 1000
(iii) If birth rate is more than death rate, then CBR results in positive growth of population.
India's population is larger than the total population of which of the following?
In the exponential growth equation Nt = Noert, e represents ______
What would be the per cent growth or birth rate per individual per hour for the same population mentioned in the previous question (Question 10)?
In 2005, for each of the 14 million people present in a country, 0.028 were born and 0.008 died during the year. Using exponential equation, the number of people present in 2015 is predicted as ______.
A population of Paramoecium caudatum was grown in a culture medium. After 5 days the culture medium became overcrowed with Paramoeium and had depleted nutrients. What will happen to the population and what type of growth curve will the population attain? Draw the growth curve.
When will be the growth of population positive in any place and in which one of the following conditions?
Analyse the main features of Phase-III (1951 - 81) of growth of population in India.
Examine the different aspects of the growth of population in India during 1951-1981 and 1981-2021.
Analyse the different aspects of population growth in India during 1901-1921 and 1921-1951.
Assertion (A): Population of a region does not change.
Reasoning (R): Birth rate, death rate and migration affect the population of a region.
Assertion (A): Population of a region does not change.
Reason (R): Birth rate, death rate and migration affect the population of a region.
Assertion (A): Population of a region does not change.
Reasoning (R): Birth rate, death rate and migration affect the population of a region.
Study the two figures shown below that represent two growth models.
 |
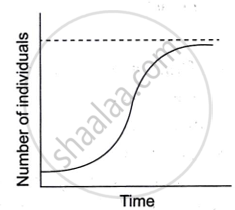 |
| Figure A | Figure B |
- Which one of the two figures represents an unlimited supply of nutrients? Give a reason.
- Which figure depicts a challenge to population growth?
- Explain the term reproductive fitness.
- Give the mathematical expressions for Figure A and Figure B.
Assertion (A): Population of a region does not change.
Reasoning (R): Birth rate, death rate and migration affect the population of a region.
Define the following term:
Growth rate of population
