Advertisements
Advertisements
प्रश्न
With the help of suitable diagram describe the logistic population growth curve.
उत्तर १
The logistic population growth curve is commonly observed in yeast cells that are grown under laboratory conditions. It includes five phases: the lag phase, positive acceleration phase, exponential phase, negative acceleration phase, and stationary phase.
(a) Lag phase: Initially, the population of the yeast cell is very small. This is because of the limited resource present in the habitat.
(b) Positive acceleration phase: During this phase, the yeast cell adapts to the new environment and starts increasing its population. However, at the beginning of this phase, the growth of the cell is very limited.
(c) Exponential phase: During this phase, the population of the yeast cell increases suddenly due to rapid growth. The population grows exponentially due to the availability of sufficient food resources, constant environment, and the absence of any interspecific competition. As a result, the curve rises steeply upwards.
(d) Negative acceleration phase: During this phase, the environmental resistance increases and the growth rate of the population decreases. This occurs due to an increased competition among the yeast cells for food and shelter.
(e) Stationary phase: During this phase, the population becomes stable. The number of cells produced in a population equals the number of cells that die. Also, the population of the species is said to have reached nature’s carrying-capacity in its habitat.

A Verhulst−pearl logistic curve is also known as an S-shaped growth curve.
उत्तर २
The S-shaped growth curve is also called a logistic growth curve. It describes a situation in which (in a new environmental condition) the population density of an organism increases slowly establishing itself then increasing rapidly, approaching an exponential growth rate. Many population of micro-organisms broadly follow this basic sigmoidal pattern. For example, when a fresh culture medium is inoculated with bacteria, sigmoidal or S-shaped growth curve is observed. The S-shaped curve is generated when a population approaches the environmental’s carrying capacity. Carrying capacity is the maximum number of individuals of a population that can be supported in a given time.

The S-shaped growth form is represented by the following equation- ” dNldt = rN[K-NIK] Where, r = intrinsic rate of natural increase N = population density at time t K = carrying capacity
APPEARS IN
संबंधित प्रश्न
Give a geographical reason:
Population may increase though birth rates are low.
Assertion: Population of a region does not change.
Reason: Birth rate, death rate and migration affect the population of a region.
India’s population as per 2011 census is:
Which one of the following is not a push factor?
Why do people migrate in large numbers from rural to urban areas in India?
How many stages/phases of population growth?
The growth of population rate per decade is ______.
The continent that has the highest growth rate of population.
What is the present annual growth rate of India?
The continent that has the lowest growth rate of population.
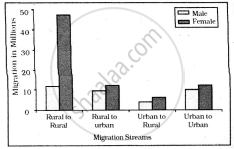
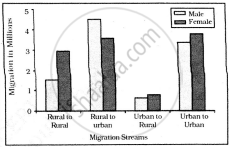
Study the given graph carefully and answer the following question:

Intra-state Migration by place of Last Residence Indicating Migration Streams India, 2011

Inter-state Migration by Place of Last Residence Indicating Migration Streams India, 2011
Who dominates the intra-state migration of short distances?
Which of the following statement is true?
(i) CBR = Bi/P × 1000
(ii) COR = D /P × 1000
(iii) If birth rate is more than death rate, then CBR results in positive growth of population.
If a population of 50 Paramoecium present in a pool increases to 150 after an hour, what would be the growth rate of population?
Assertion (A): Population of a region does not change.
Reasoning (R): Birth rate, death rate and migration affect the population of a region.
Which one of the following is the largest linguistic group of India?
A : Population of a region does not change.
R : Birth rate, death rate and migration affect the population of a region.
A: The population of a region does not change.
R: Birth rate, death rate and migration affect the population of a region.
Assertion (A): Population of a region does not change.
Reasoning (R): Birth rate, death rate and migration affect the population of a region.
Assertion: Population of a region does not change.
Reasoning: Birth rate, death rate and migration affect the population of a region.
Assertion (A): Population of a region does not change.
Reasoning (R): Birth rate, death rate and migration affect the population of a region.
