Advertisements
Advertisements
प्रश्न
The bar graph given below represents the circulation of newspapers in different languages in a town. Study the bar graph and answer the following questions:
Scale: 1 unit length = 200 Newspapers
(a) What is the circulation of English newspaper?
(b) Name the two languages in which circulation of newspaper is the same.
(c) By how much is the circulation of newspaper in Hindi more than the newspaper in Bengali?
उत्तर
(a) From the graph, we can observe that about 1000 English newspapers are in circulation.
(b) Marathi and Bengali are the two languages in which circulation of newspapers is the same.
(c) Given, circulation of newspapers in Hindi = 1400 and circulation of newspapers in Bengali = 600. So, difference = 1400 – 600 = 800
The circulation of newspapers in Hindi is 800 more than the newspapers in Bengali.
APPEARS IN
संबंधित प्रश्न
Number of children in six different classes are given below. Represent the data on a bar graph.
| Class | Fifth | Sixth | Seventh | Eighth | Ninth | Tenth |
| Number of children | 135 | 120 | 95 | 100 | 90 | 80 |
- How would you choose a scale?
- Answer the following questions:
- Which class has the maximum number of children? And the minimum?
- Find the ratio of students of class sixth to the students of class eight.
In a bar graph, bars of ______ width can be drawn horizontally or vertically with ______ spacing between them.
The bar graph given below represents approximate length (in kilometres) of some National Highways in India. Study the bar graph and answer the following questions:
Scale: 1 unit length = 200 km
(a) Which National Highway (N.H.) is the longest among the above?
(b) Which National Highway is the shortest among the above?
(c) What is the length of National Highway 9?
(d) Length of which National Highway is about three times the National Highway10?
The lengths in km (rounded to nearest hundred) of some major rivers of India is given below
| River | Length (in km) |
| Narmada | 1300 |
| Mahanadi | 900 |
| Brahmputra | 2900 |
| Ganga | 2500 |
| Kaveri | 800 |
| Krishna | 1300 |
Draw a bar graph to represent the above information.
Number of mobile phone users in various age groups in a city is listed below:
| Age group (in years) | Number of mobile users |
| 1 – 20 | 25000 |
| 21 – 40 | 40000 |
| 41 – 50 | 35000 |
| 61 – 80 | 10000 |
Draw a bar graph to represent the above information.
______ can be used to compare two collections of data.
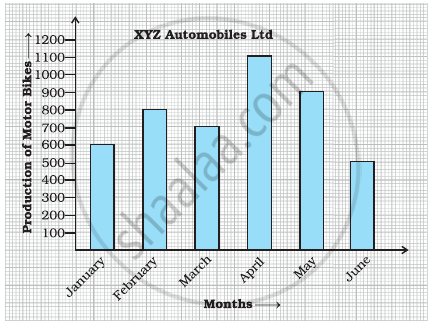
Observe the given bar graph carefully and answer the questions that follow.
- What information does the bar graph depict?
- How many motor bikes were produced in the first three months?
- Calculate the increase in production in May over the production in January.
- In which month the production was minimum and what was it?
- Calculate the average (mean) production of bikes in 6 months.
The bar graph given below shows the marks of students of a class in a particular subject:

Study the bar graph and answer the following questions:
- If 40 is the pass mark, then how many students have failed?
- How many students got marks from 50 to 69?
- How many students scored 90 marks and above?
- If students who scored marks above 80 are given merits then how many merit holders are there?
- What is the strength of the class?
Study the bar graph given below and answer the questions that follow.

- What information does the above bar graph represent?
- In which year was production the least?
- After which year was the maximum rise in the production?
- Find the average production of rice during the 5 years.
- Find difference of rice production between years 2006 and 2008.
The students of Class VII have to choose one club from Music, Dance, Yoga, Dramatics, Fine arts and Electronics clubs. The data given below shows the choices made by girls and boys of the class. Study the table and answer the questions that follow:
| Clubs | Music | Dance | Yoga | Dramatics | Fine Arts | Electronics |
| Girls | 15 | 24 | 10 | 19 | 27 | 21 |
| Boys | 12 | 16 | 8 | 17 | 11 | 30 |
- Draw a double bar graph using appropriate scale to depict the above data.
- How many students are there in Class VII?
- Which is the most preferred club by boys?
- Which is the least preferred club by girls?
- For which club the difference between boys and girls is the least?
- For which club is the difference between boys and girls the maximum?
