Advertisements
Advertisements
प्रश्न
The graph of every linear equation in two variables need not be a line.
पर्याय
True
False
उत्तर
This statement is False.
Explanation:
The graph of every linear equation in two variables is always a line.
APPEARS IN
संबंधित प्रश्न
In countries like USA and Canada, temperature is measured in Fahrenheit, whereas in countries like India, it is measured in Celsius. Here is a linear equation that converts Fahrenheit to Celsius:-
`F=(9/5)C+32`
(i) Draw the graph of the linear equation above using Celsius for x-axis and Fahrenheit for y-axis.
(ii) If the temperature is 30°C, what is the temperature in Fahrenheit?
(iii) If the temperature is 95°F, what is the temperature in Celsius?
(iv) If the temperature is 0°C, what is the temperature in Fahrenheit and if the temperature is 0°F, what is the temperature in Celsius?
(v) Is there a temperature which is numerically the same in both Fahrenheit and Celsius? If yes, find it.
Draw the graph of the following linear equation in two variable : 3x + 5y = 15
Solve, graphically, the following pairs of equations :
`(x + 1)/(4) = (2)/(3)(1 - 2y)`
`(2 + 5y)/(3) = x/(7) -2`
Draw the graph for the following
y = `(3/2)x + 3`
Draw the graph of the following equation:
x = – 7
The graph of y = 6 is a line ______.
The graph of the linear equation 2x + 3y = 6 is a line which meets the x-axis at the point ______.
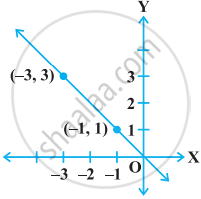
The graph given below represents the linear equation x + y = 0.

The graph given below represents the linear equation x = 3 (see figure).

Draw the graph of the linear equation 3x + 4y = 6. At what points, the graph cuts the x-axis and the y-axis.
