Advertisements
Advertisements
प्रश्न
Draw the graphs of linear equations y = x and y = – x on the same cartesian plane. What do you observe?
उत्तर
The given equation is y = x. To draw the graph of this equation, we need at least two points lying on the given line.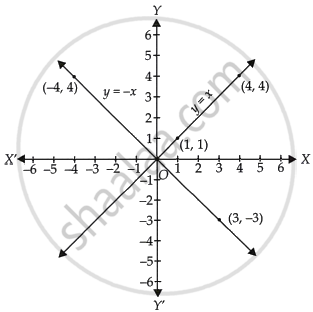
For x = 1, y = 1, therefore (1, 1) satisfies the linear equation y = x.
For x = 4, y = 4, therefore (4, 4) satisfies the linear equation y = x.
By plotting the points (1, 1) and (4, 4) on the graph paper and joining them by a line, we obtain the graph of y = x.
The given equation is y = – x. To draw the graph of this equation, we need at least two points lying on the given line.
For x = 3, y = – 3, therefore, (3, – 3) satisfies the linear equation y = – x.
For x = – 4, y = 4, therefore, (– 4, 4) satisfies the linear equation y = – x.
By plotting the points (3, – 3) and (– 4, 4) on the graph paper and joining them by a line, we obtain the graph of y = – x.
We observe that, the line y = x and y = – x intersect at the point O(0, 0).
APPEARS IN
संबंधित प्रश्न
Draw the graph for the equation, given below :
2x + 3y = 0
Draw the graph for the equation, given below :
5x + y + 5 = 0
Use the graphical method to find the value of k, if:
(5, k - 2) lies on the straight line x - 2y + 1 = 0
Solve, graphically, the following pairs of equation :
2x + y = 23
4x - y = 19
Draw the graph for each of the following equation: Also, find the coordinates of the points where the graph of the equation meets the coordinate axes:
`(1)/(2) x + (1)/(3) y` = 1
Use the given table and draw the graph of a straight line.
| X | 1 | 2 | 3 | P |
| Y | 1 | q | -5 | 7 |
Find graphically the values of 'p' and 'q'.
A straight line passes through the points (2, 5) and (-4, -7). Plot these points on a graph paper and draw the straight line passes through these points. If points (a, -1) and (-5, b) lie on the line drawn, find the value of a and b.
Draw the graph for the following
y = 4x – 1
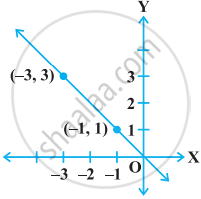
The graph given below represents the linear equation x + y = 0.
Show that the points A(1, 2), B(– 1, – 16) and C(0, – 7) lie on the graph of the linear equation y = 9x – 7.
