Advertisements
Advertisements
प्रश्न
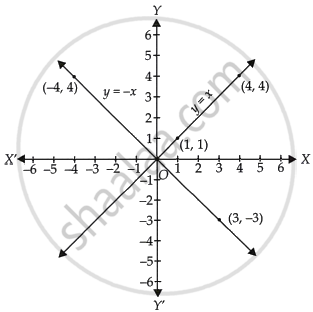
Draw the graphs of linear equations y = x and y = – x on the same cartesian plane. What do you observe?
उत्तर
The given equation is y = x. To draw the graph of this equation, we need at least two points lying on the given line.
For x = 1, y = 1, therefore (1, 1) satisfies the linear equation y = x.
For x = 4, y = 4, therefore (4, 4) satisfies the linear equation y = x.
By plotting the points (1, 1) and (4, 4) on the graph paper and joining them by a line, we obtain the graph of y = x.
The given equation is y = – x. To draw the graph of this equation, we need at least two points lying on the given line.
For x = 3, y = – 3, therefore, (3, – 3) satisfies the linear equation y = – x.
For x = – 4, y = 4, therefore, (– 4, 4) satisfies the linear equation y = – x.
By plotting the points (3, – 3) and (– 4, 4) on the graph paper and joining them by a line, we obtain the graph of y = – x.
We observe that, the line y = x and y = – x intersect at the point O(0, 0).
APPEARS IN
संबंधित प्रश्न
If the point (3, 4) lies on the graph of the equation 3y = ax + 7, find the value of a.
Draw the graph of the following linear equations in two variable : 2𝑦 = −𝑥 + 1
Draw the graph of the equation given below. Also, find the coordinates of the point
where the graph cuts the coordinate axes : −x + 4y = 8
Draw the graph of the equation 2x + y = 6. Shade the region bounded by the graph and the
coordinate axes. Also, find the area of the shaded region.
Draw the graph of y = | x |.
Draw the graph of y = | x | + 2.
A pair of linear equations has no solution then the graphical representation is
The graph of the linear equation 2x + 3y = 6 is a line which meets the x-axis at the point ______.
The graph of the linear equation y = x passes through the point ______.
If the point (3, 4) lies on the graph of 3y = ax + 7, then find the value of a.
