Advertisements
Advertisements
प्रश्न
The marks scored by 20 students in a test are given below:
54, 42, 68, 56, 62, 71, 78, 51, 72, 53, 44, 58, 47, 64, 41, 57, 89, 53, 84, 57.
Complete the following frequency table:
| (Marks in class intervals) | Tally marks | Frequency (no. of children) |
| 40 - 50 | ||
| 50 - 60 | ||
| 60 - 70 | ||
| 70 - 80 | ||
| 80 - 90 |
What is the class interval in which the greatest frequency occurs?
उत्तर
The frequency table can be completed as follows:
| Marks in class intervals | Tally Marks | Frequency |
| 40 - 50
|
|||| | 4 |
| 50 - 60 | `cancel(bb|bb|bb|bb|)|||` | 8 |
| 60 - 70 | ||| | 3 |
| 70 - 80 | ||| | 3 |
| 80 - 90 | || | 2 |
The class interval with the greatest frequency (8) is 50 - 60.
APPEARS IN
संबंधित प्रश्न
The final mark in mathematic of 30 student are as follow:
| 53, | 61, | 48, | 60, | 78, | 68, | 55, | 100, | 67, | 90, | 75, | 88, | 77, | 37, | 84, |
| 58, | 60, | 48, | 62, | 56, | 44, | 58, | 52, | 64, | 98, | 59, | 70, | 39, | 50, | 60 |
Arrange these marks in the ascending order, 30 to 39 one group, 40 to 49 second group etc.
Now answer the following:
(ii) What is the highest score?
(iii) What is the lowest score?
(iv) What is the range?
(v) If 40 is the pass mark how many have failed?
(vi) How many have scored 75 or more?
(vii) Which observations between 50 and 60 have not actually appeared?
(viii) How many have scored less than 50?
The weights of new born babies (in kg) in a hospital on a particular day are as follows:
2.3, 2.2, 2.1, 2.7, 2.6, 3.0, 2.5, 2.9, 2.8, 3.1, 2.5, 2.8, 2.7, 2.9, 2.4
(i) Rearrange the weights in descending order.
(ii) Determine the highest weight.
(iii) Determine the lowest weight.
(iv) Determine the range.
(v) How many babies were born on that day?
(vi) How many babies weigh below 2.5 kg?
(vii) How many babies weigh more than 2.8 kg?
(viii) How many babies weigh 2.8 kg?
Prepare a frequency table of the following ages (in years) of 30 students of class VIII in your school:
13, 14, 13, 12, 14, 13, 14, 15, 13, 14, 13, 14, 16, 12, 14, 13, 14, 15, 16, 13, 14, 13, 12, 17, 13, 12, 13, 13, 13, 14
The tally marks |||| |||| represents the number count
The heights (in centimeters) of 40 children are.
| 110 | 112 | 112 | 116 | 119 | 111 | 113 | 115 | 118 | 120 |
| 110 | 113 | 114 | 111 | 114 | 113 | 110 | 120 | 118 | 115 |
| 112 | 110 | 116 | 111 | 115 | 120 | 113 | 111 | 113 | 120 |
| 115 | 111 | 116 | 112 | 110 | 111 | 120 | 111 | 120 | 111 |
Prepare a tally marks table
Yamini did a project ‘Animals and Birds’. She asked each child in her class about one favorite pet animal.
She used tally marks to record each answer. For example, if someone said ‘cat’ she means 5 cats. In all 24 children said ‘cat’ was their favorite animal. Help Yamini complete the table.
| Animal | Tally marks | Number |
| Cats | 24 | |
| Dogs | ||
| Rabbits | ||
| Cows | ||
| Parrots | ||
| Goats | ||
| Squirrel |
- Look at the tally marks and write the number for each animal on the table. How many children in all did Yamini talk to?
- Which is the most favorite pet animal on this table?
- Which pet will you like to have? What will you name it? Which other animals can be kept at home? Discuss.
Sumita stood on the road for half an hour and counted the number of vehicles passing by. She made a tally mark for each vehicle. This helped her in counting the total number of vehicles in each group.
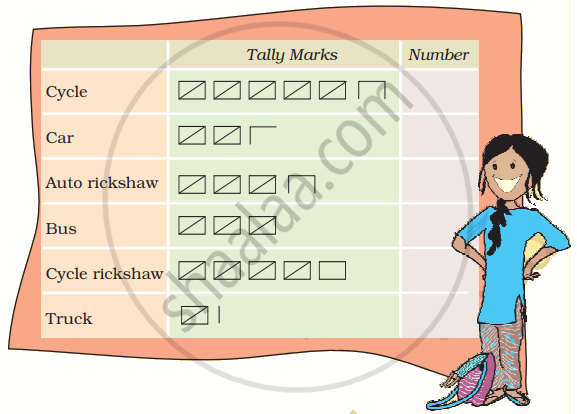
- Write the number of each vehicle in the table.
- How many vehicles in all did Sumita see on the road in half an hour?
- Auto rickshaws are thrice the number of trucks — true/false?
- Make tally marks for 7 more buses and 2 more trucks.
The sixth class interval for a grouped data whose first two class intervals are 10 – 15 and 15 – 20 is ______.
According to data of question 4, which fruit is liked by most of the students?
In a Mathematics test, the following marks were obtained by 40 students. Arrange these marks in a table using tally marks.
| 8 | 1 | 3 | 7 | 6 | 5 | 5 | 4 | 4 | 2 |
| 4 | 9 | 5 | 3 | 7 | 1 | 6 | 5 | 2 | 7 |
| 7 | 3 | 8 | 4 | 2 | 8 | 9 | 5 | 8 | 6 |
| 7 | 4 | 5 | 6 | 9 | 6 | 4 | 4 | 6 | 6 |
How many students obtained marks below 4?
