Advertisements
Advertisements
प्रश्न
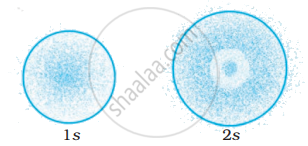
The probability density plots of 1s and 2s orbitals are given in Figure:

The density of dots in a region represents the probability density of finding electrons in the region.
On the basis of above diagram which of the following statements is incorrect?
पर्याय
1s and 2s orbitals are spherical in shape.
The probability of finding the electron is maximum near the nucleus.
The probability of finding the electron at a given distance is equal in all directions.
The probability density of electrons for 2s orbital decreases uniformly as distance from the nucleus increases.
उत्तर
The probability density of electrons for 2s orbital decreases uniformly as distance from the nucleus increases.
Explanation:

As per the probability density curve, the probability of finding the electrons at the 1s orbital decreases as we move far from the nucleus, however in case of 2s the probability decreases initially then it increases with the distance and thereafter at a certain point it starts decreasing with the distance.
APPEARS IN
संबंधित प्रश्न
Using s, p, d notations, describe the orbital with the following quantum numbers n = 1, l = 0.
State the order of filling atomic orbitals following Aufbau principle.
Draw shapes of 2p orbitals.
The principal quantum number (n) and magnetic quantum number (ml) for the valence electrons of rubidium atom (Z = 37) are ____________ respectively.
How many electrons can fit in the orbital for which n = 4 and l = 2?
Which of the following has a greater number of electrons than neutrons?
(Mass number of Mg, C, O and Na is 24, 12, 16 and 23 respectively).
Which one of the following is NOT possible?
Which of the following orbitals are degenerate?
3dxy, 4dxy 3dz2, 3dyz, 4dyz, 4dz2
The arrangement of orbitals on the basis of energy is based upon their (n + l) value. Lower the value of (n + l), lower is the energy. For orbitals having same values of (n + l), the orbital with lower value of n will have lower energy.
Based upon the above information, solve the questions given below:
Which of the following orbitals has the lowest energy?
5p, 5d, 5f, 6s, 6p
Which of the following is not the permissible arrangement of electrons in an atom?
