Advertisements
Advertisements
प्रश्न
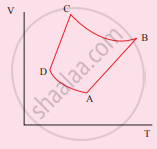
The V-T diagram of an ideal gas which goes through a reversible cycle A→B→C→D is shown below. (Processes D→A and B→C are adiabatic)
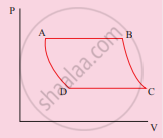
The corresponding PV diagram for the process is (all figures are schematic)
पर्याय
उत्तर
APPEARS IN
संबंधित प्रश्न
Draw a p-V diagram showing negative work with varying pressure.
Draw the PV diagram for the isobaric process.
Derive the work done in an isothermal process.
Explain in detail an adiabatic process.
Derive the work done in an adiabatic process.
Draw the TP diagram (P-x axis, T-y axis), VT(T-x axis, V-y axis) diagram for
- Isochoric process
- Isothermal process
- Isobaric process
In which of the following processes, beat is neither absorbed nor released by a system?
We consider a thermodynamic system. If `Delta"U"` represents the increase in its internal energy and W the work done by the system, which of the following statements is true?
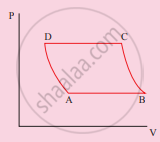
Consider P-V diagram for an ideal gas shown in figure.
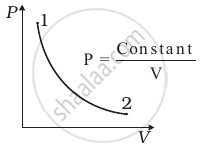
Out of the following diagrams (figure), which represents the T-P diagram?
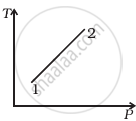 (i) |
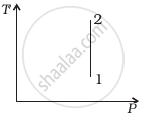 (ii) |
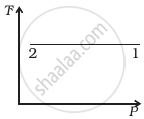 (iii) |
 (iv) |
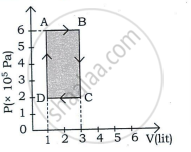
An ideal gas is taken through a cyclic process ABCDA as shown in figure. The net work done by the gas during the cycle is ______.
