Advertisements
Advertisements
Question
Define the following term:
Frequency of an observation
Solution
Frequency of an observation is the number of times a certain value or a class of values occurs.
APPEARS IN
RELATED QUESTIONS
Organise the following marks in a class assessment, in a tabular form.
4, 6, 7, 5, 3, 5, 4, 5, 2, 6, 2, 5, 1, 9, 6, 5, 8, 4, 6, 7
- Which number is the highest?
- Which number is the lowest?
- What is the range of the data?
- Find the arithmetic mean.
Define the following term:
Class-size
Define the following term:
Class limits
The final mark in mathematic of 30 student are as follow:
| 53, | 61, | 48, | 60, | 78, | 68, | 55, | 100, | 67, | 90, | 75, | 88, | 77, | 37, | 84, |
| 58, | 60, | 48, | 62, | 56, | 44, | 58, | 52, | 64, | 98, | 59, | 70, | 39, | 50, | 60 |
Arrange these marks in the ascending order, 30 to 39 one group, 40 to 49 second group etc.
Now answer the following:
(ii) What is the highest score?
(iii) What is the lowest score?
(iv) What is the range?
(v) If 40 is the pass mark how many have failed?
(vi) How many have scored 75 or more?
(vii) Which observations between 50 and 60 have not actually appeared?
(viii) How many have scored less than 50?
A die was thrown 25 times and following scores were obtained:
| 1, | 5, | 2, | 4, | 3, | 6, | 1, | 4, | 2, | 5, | 1, | 6, | 2, |
| 6, | 3, | 5, | 4, | 1, | 3, | 2, | 3, | 6, | 1, | 5, | 2, |
Prepare a frequency table of the scores.
The marks scored by 20 students in a test are given below:
54, 42, 68, 56, 62, 71, 78, 51, 72, 53, 44, 58, 47, 64, 41, 57, 89, 53, 84, 57.
Complete the following frequency table:
| (Marks in class intervals) | Tally marks | Frequency (no. of children) |
| 40 - 50 | ||
| 50 - 60 | ||
| 60 - 70 | ||
| 70 - 80 | ||
| 80 - 90 |
What is the class interval in which the greatest frequency occurs?
Construct a frequency table with equal class intervals from the following data on the monthly wages (in rupees) of 28 labourers working in a factory, taking one of the class intervals as 210-230 (230 not included):
220, 268, 258, 242, 210, 268, 272, 242, 311, 290, 300, 320, 319, 304, 302, 318, 306, 292, 254, 278, 210, 240, 280, 316, 306, 215, 256, 236.
The following list tells colours liked by 25 students. Prepare a table using Tally Marks.
| Red | Blue | White | Grey | White |
| Green | Grey | Blue | Green | Grey |
| Blue | Grey | Red | Green | Red |
| Blue | Blue | Green | Blue | Green |
| Grey | Grey | Green | Grey | Red |
The tally marks for the number 7 in standard form is _____________
The heights (in centimeters) of 40 children are.
| 110 | 112 | 112 | 116 | 119 | 111 | 113 | 115 | 118 | 120 |
| 110 | 113 | 114 | 111 | 114 | 113 | 110 | 120 | 118 | 115 |
| 112 | 110 | 116 | 111 | 115 | 120 | 113 | 111 | 113 | 120 |
| 115 | 111 | 116 | 112 | 110 | 111 | 120 | 111 | 120 | 111 |
Prepare a tally marks table
Sumita stood on the road for half an hour and counted the number of vehicles passing by. She made a tally mark for each vehicle. This helped her in counting the total number of vehicles in each group.
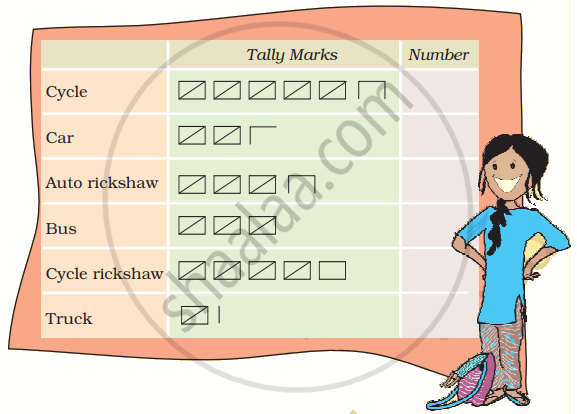
- Write the number of each vehicle in the table.
- How many vehicles in all did Sumita see on the road in half an hour?
- Auto rickshaws are thrice the number of trucks — true/false?
- Make tally marks for 7 more buses and 2 more trucks.
The sixth class interval for a grouped data whose first two class intervals are 10 – 15 and 15 – 20 is ______.
The choices of the fruits of 42 students in a class are as follows:
A, O, B, M, A, G, B, G, A, G, B, M, A, G, M, A, B, G, M, B, A, O, M, O, G, B, O, M, G, A, A, B, M, O, M, G, B, A, M, O, M, O, where A, B, G, M and O stand for the fruits Apple, Banana, Grapes, Mango and Orange respectively. Which two fruits are liked by an equal number of students?
An observation occurring five times in a data is recorded as | | | | |, using tally marks.
In an examination, the grades achieved by 30 students of a class are given below. Arrange these grades in a table using tally marks:
B, C, C, E, A, C, B, B, D, D, D, D, B, C, C, C, A, C, B, E, A, D, C, B, E, C, B, E, C, D
Fill in the blanks in the following table which represents shirt size of 40 students of a school.
| Shirt size | Tally Marks | Number of students |
| 30 | ||| | 3 |
| 32 | `cancel(bb|bb|bb|bb|)` | ______ |
| 34 | ______ | 8 |
| 36 | `cancel(bb|bb|bb|bb|)` || | ______ |
| 38 | `cancel(bb|bb|bb|bb|)` ______ | 10 |
| 40 | ______ | 7 |
| Number of two wheelers |
Tally marks | Number of families |
| 0 | ||| | 3 |
| 1 | `cancel(|bb|bb|bb|)` `cancel(|bb|bb|bb|)` `cancel(|bb|bb|bb|)` `cancel(|bb|bb|bb|)` `cancel(|bb|bb|bb|)` ||| | 28 |
| 2 | `cancel(|bb|bb|bb|)` `cancel(|bb|bb|bb|)` |||| | 14 |
| 3 | |||| | 4 |
| 4 | | | 1 |
| Total | 50 |
Prepare a bar graph of the data.
Catherine threw a dice 40 times and noted the number appearing each time as shown below:
| 1 | 3 | 5 | 6 | 6 | 3 | 5 | 4 | 1 | 6 |
| 2 | 5 | 3 | 4 | 6 | 1 | 5 | 5 | 6 | 1 |
| 1 | 2 | 2 | 3 | 5 | 2 | 4 | 5 | 5 | 6 |
| 5 | 1 | 6 | 2 | 3 | 5 | 2 | 4 | 1 | 5 |
Make a table and enter the data using tally marks. Find the number that appeared.
The maximum number of times
