Advertisements
Advertisements
Question
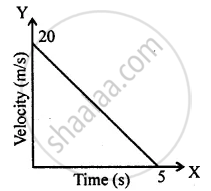
Diagram shows a velocity – time graph for a car starting from rest. The graph has three sections AB, BC and CD.

Compare the distance travelled in section BC with the distance travelled in section AB.
Solution
`"Distance travelled in part BC"/"Distance travelled in part AB"=("v"_0xx"t")/(1/2xx"t"xx"v"_0)=2/1=2:1`
APPEARS IN
RELATED QUESTIONS
Fill in the following blank with suitable word :
In a speed-time graph, the area enclosed by the speed-time curve and the time axis gives the…………….. by the body.
Multiple choice Question. Select the correct option.
The slope of displacement – time graph represents.
Multiple choice Question. Select the correct option.
The distance covered in the adjoining velocity-time graph is :
A ball is thrown up vertically and returns back to thrower in 6 s. Assuming there is no air friction, plot a graph between velocity and time. From the graph calculate
- deceleration
- acceleration
- total distance covered by ball
- average velocity.
A body at rest is thrown downward from the top of the tower. Draw a distance – time graph of its free fall under gravity during the first 3 seconds. Show your table of values starting t = 0 with an interval of 1 second, (g = 10 ms−2).
Given on th e side are a few speed - time graphs for various objects moving along a stra ight line. Refer below figure. (a), (b), (c) and (d).
Which of these graphs represent
(a) Uni form motion
(b) Motion with speed increasing
(c) Motion with speed decreasing and
(d) Motion with speed oscillating.?
Draw the speed-time graph of a body starting from some point P, gradually picking up speed, then running at a uniform speed and finally slowing down to stop at some point Q.
Draw the following graph:
Speed versus time for a fluctuating speed.
A straight line parallel to the x-axis in the velocity-time graph represents the object moving in ______.
From the v-t graph, ______ can be calculated.
